Turn on suggestions
Auto-suggest helps you quickly narrow down your search results by suggesting possible matches as you type.
Showing results for
Data Engineering
Turn on suggestions
Auto-suggest helps you quickly narrow down your search results by suggesting possible matches as you type.
Showing results for
- Databricks
- Data Engineering
- How to find out why the cluster is in PENDING stat...
Options
- Subscribe to RSS Feed
- Mark Topic as New
- Mark Topic as Read
- Float this Topic for Current User
- Bookmark
- Subscribe
- Mute
- Printer Friendly Page
Options
- Mark as New
- Bookmark
- Subscribe
- Mute
- Subscribe to RSS Feed
- Permalink
- Report Inappropriate Content
08-01-2022 07:15 AM
I'm using Databricks on AWS. Our clusters are typically in PENDING state for 5-8 minutes after they are created. I would like to find out why (ec2 instance provisioning? docker image download is slow? ...?). The cluster logs are not helpful enough because I only see the timestamps of init script execution which is in our case is ~2 seconds.
I'd like to improve startup times. How can I find out what takes so much time to launch the cluster? Is there some logging or event emitting that I can read and analyze?
Labels:
- Labels:
-
AWS
-
Cluster
-
Pending State
1 ACCEPTED SOLUTION
Accepted Solutions
Options
- Mark as New
- Bookmark
- Subscribe
- Mute
- Subscribe to RSS Feed
- Permalink
- Report Inappropriate Content
08-02-2022 06:27 AM
Unfortunately, this is not available either on the UI or via API. We get this information only from the backend logs. If you feel this information is required for some analysis, I would recommend raising a feature request for this via our ideas portal.
5 REPLIES 5
Options
- Mark as New
- Bookmark
- Subscribe
- Mute
- Subscribe to RSS Feed
- Permalink
- Report Inappropriate Content
08-01-2022 03:51 PM
Hi @Sergey Ivanychev , Did you check if there are any legacy init-scripts loaded on the DBFS? Check for any scripts under dbfs:/databricks/init.
Options
- Mark as New
- Bookmark
- Subscribe
- Mute
- Subscribe to RSS Feed
- Permalink
- Report Inappropriate Content
08-02-2022 01:34 AM
Nope, there's nothing
Options
- Mark as New
- Bookmark
- Subscribe
- Mute
- Subscribe to RSS Feed
- Permalink
- Report Inappropriate Content
08-02-2022 04:15 AM
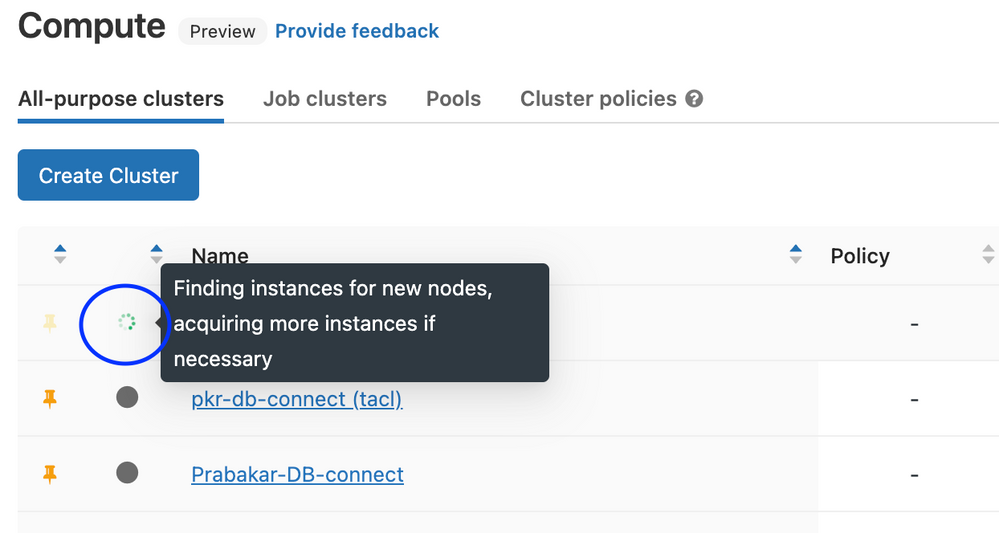
hi @Sergey Ivanychev while the cluster is starting, you can see the status on the compute page. Hover the mouse pointer to the green rotating circle on the left of the cluster name. It will give a notification of what is happening on the cluster. While I captured the screenshot, the cluster was finding for new nodes. This might help you to get some insights on why there is a delay.
Options
- Mark as New
- Bookmark
- Subscribe
- Mute
- Subscribe to RSS Feed
- Permalink
- Report Inappropriate Content
08-02-2022 05:06 AM
That sounds promising, thanks! Is this data available via any API or logged anywhere?
Options
- Mark as New
- Bookmark
- Subscribe
- Mute
- Subscribe to RSS Feed
- Permalink
- Report Inappropriate Content
08-02-2022 06:27 AM
Unfortunately, this is not available either on the UI or via API. We get this information only from the backend logs. If you feel this information is required for some analysis, I would recommend raising a feature request for this via our ideas portal.
Announcements
Welcome to Databricks Community: Lets learn, network and celebrate together
Join our fast-growing data practitioner and expert community of 80K+ members, ready to discover, help and collaborate together while making meaningful connections.
Click here to register and join today!
Engage in exciting technical discussions, join a group with your peers and meet our Featured Members.
Related Content
- Help - org.apache.spark.SparkException: Job aborted due to stage failure: Task 47 in stage 2842.0 in Machine Learning
- Read Structured Streaming state information in Warehousing & Analytics
- Issue with applying ACL's in Unit catlog enabled workspace in Data Engineering
- Intermittently unavailable: Maven library com.crealytics:spark-excel_2.12:3.5.0_0.20.3 in Data Engineering
- Cannot connect to SQL Warehouse using JDBC connector in Spark in Warehousing & Analytics


