Turn on suggestions
Auto-suggest helps you quickly narrow down your search results by suggesting possible matches as you type.
Showing results for
Data Engineering
Turn on suggestions
Auto-suggest helps you quickly narrow down your search results by suggesting possible matches as you type.
Showing results for
- Databricks
- Data Engineering
- Create a Dashboard: How do I visualize data with D...
Options
- Subscribe to RSS Feed
- Mark Topic as New
- Mark Topic as Read
- Float this Topic for Current User
- Bookmark
- Subscribe
- Mute
- Printer Friendly Page
Options
- Mark as New
- Bookmark
- Subscribe
- Mute
- Subscribe to RSS Feed
- Permalink
- Report Inappropriate Content
08-10-2022 12:05 AM
Databricks SQL helps query and visualize data so you can share real-time business insights with built-in dashboards or your favorite BI tools.
This post helps you create queries, visualizations and dashboards and connect to your BI tools for deeper data insights so you can:
• Test and validate requirements
• Monitor KPIs
• Share visual insights with your team
• Set automated refresh schedules to always have the latest data
Pre-req
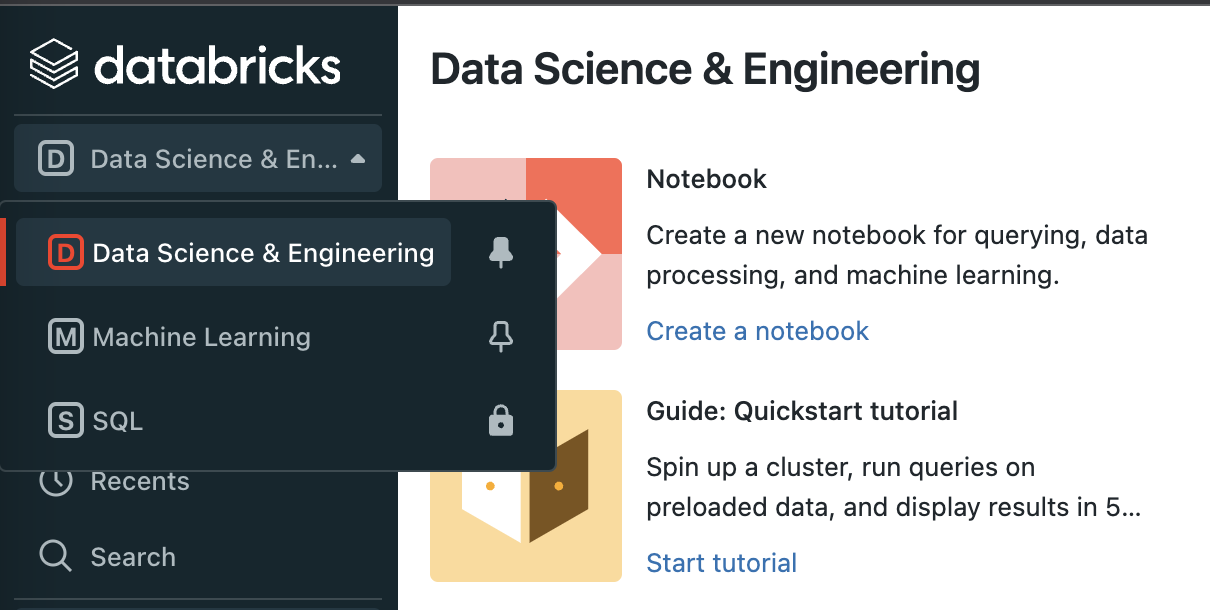
• You have permission to access the Databricks SQL workspace, found in the product’s left-hand navigation bar

• Note: Databricks SQL is only available for Premium or Enterprise subscriptions, Standard subscriptions must first be upgraded by contacting your account team. If you don't have access, a lock on the persona will be displayed

Steps to create queries, visualizations and dashboards
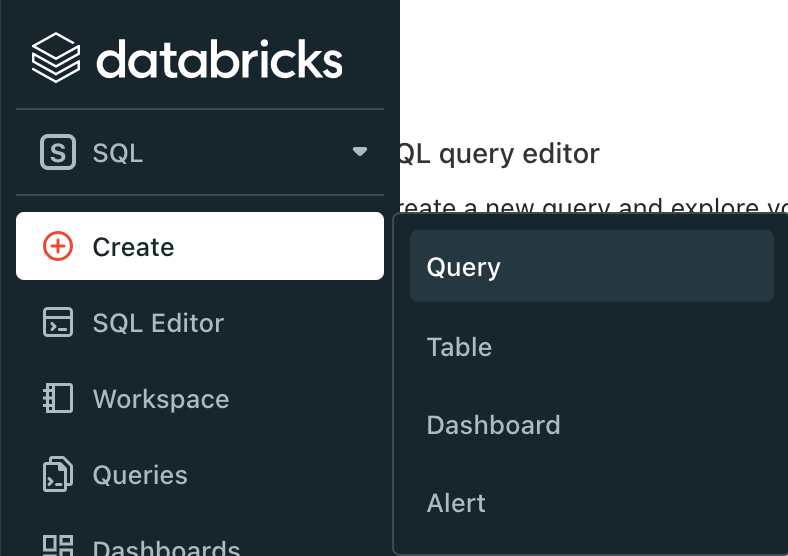
1. Go to the Databricks SQL homepage, click Create, and select Query


2. To run a query, select a SQL Warehouse and choose from available data objects
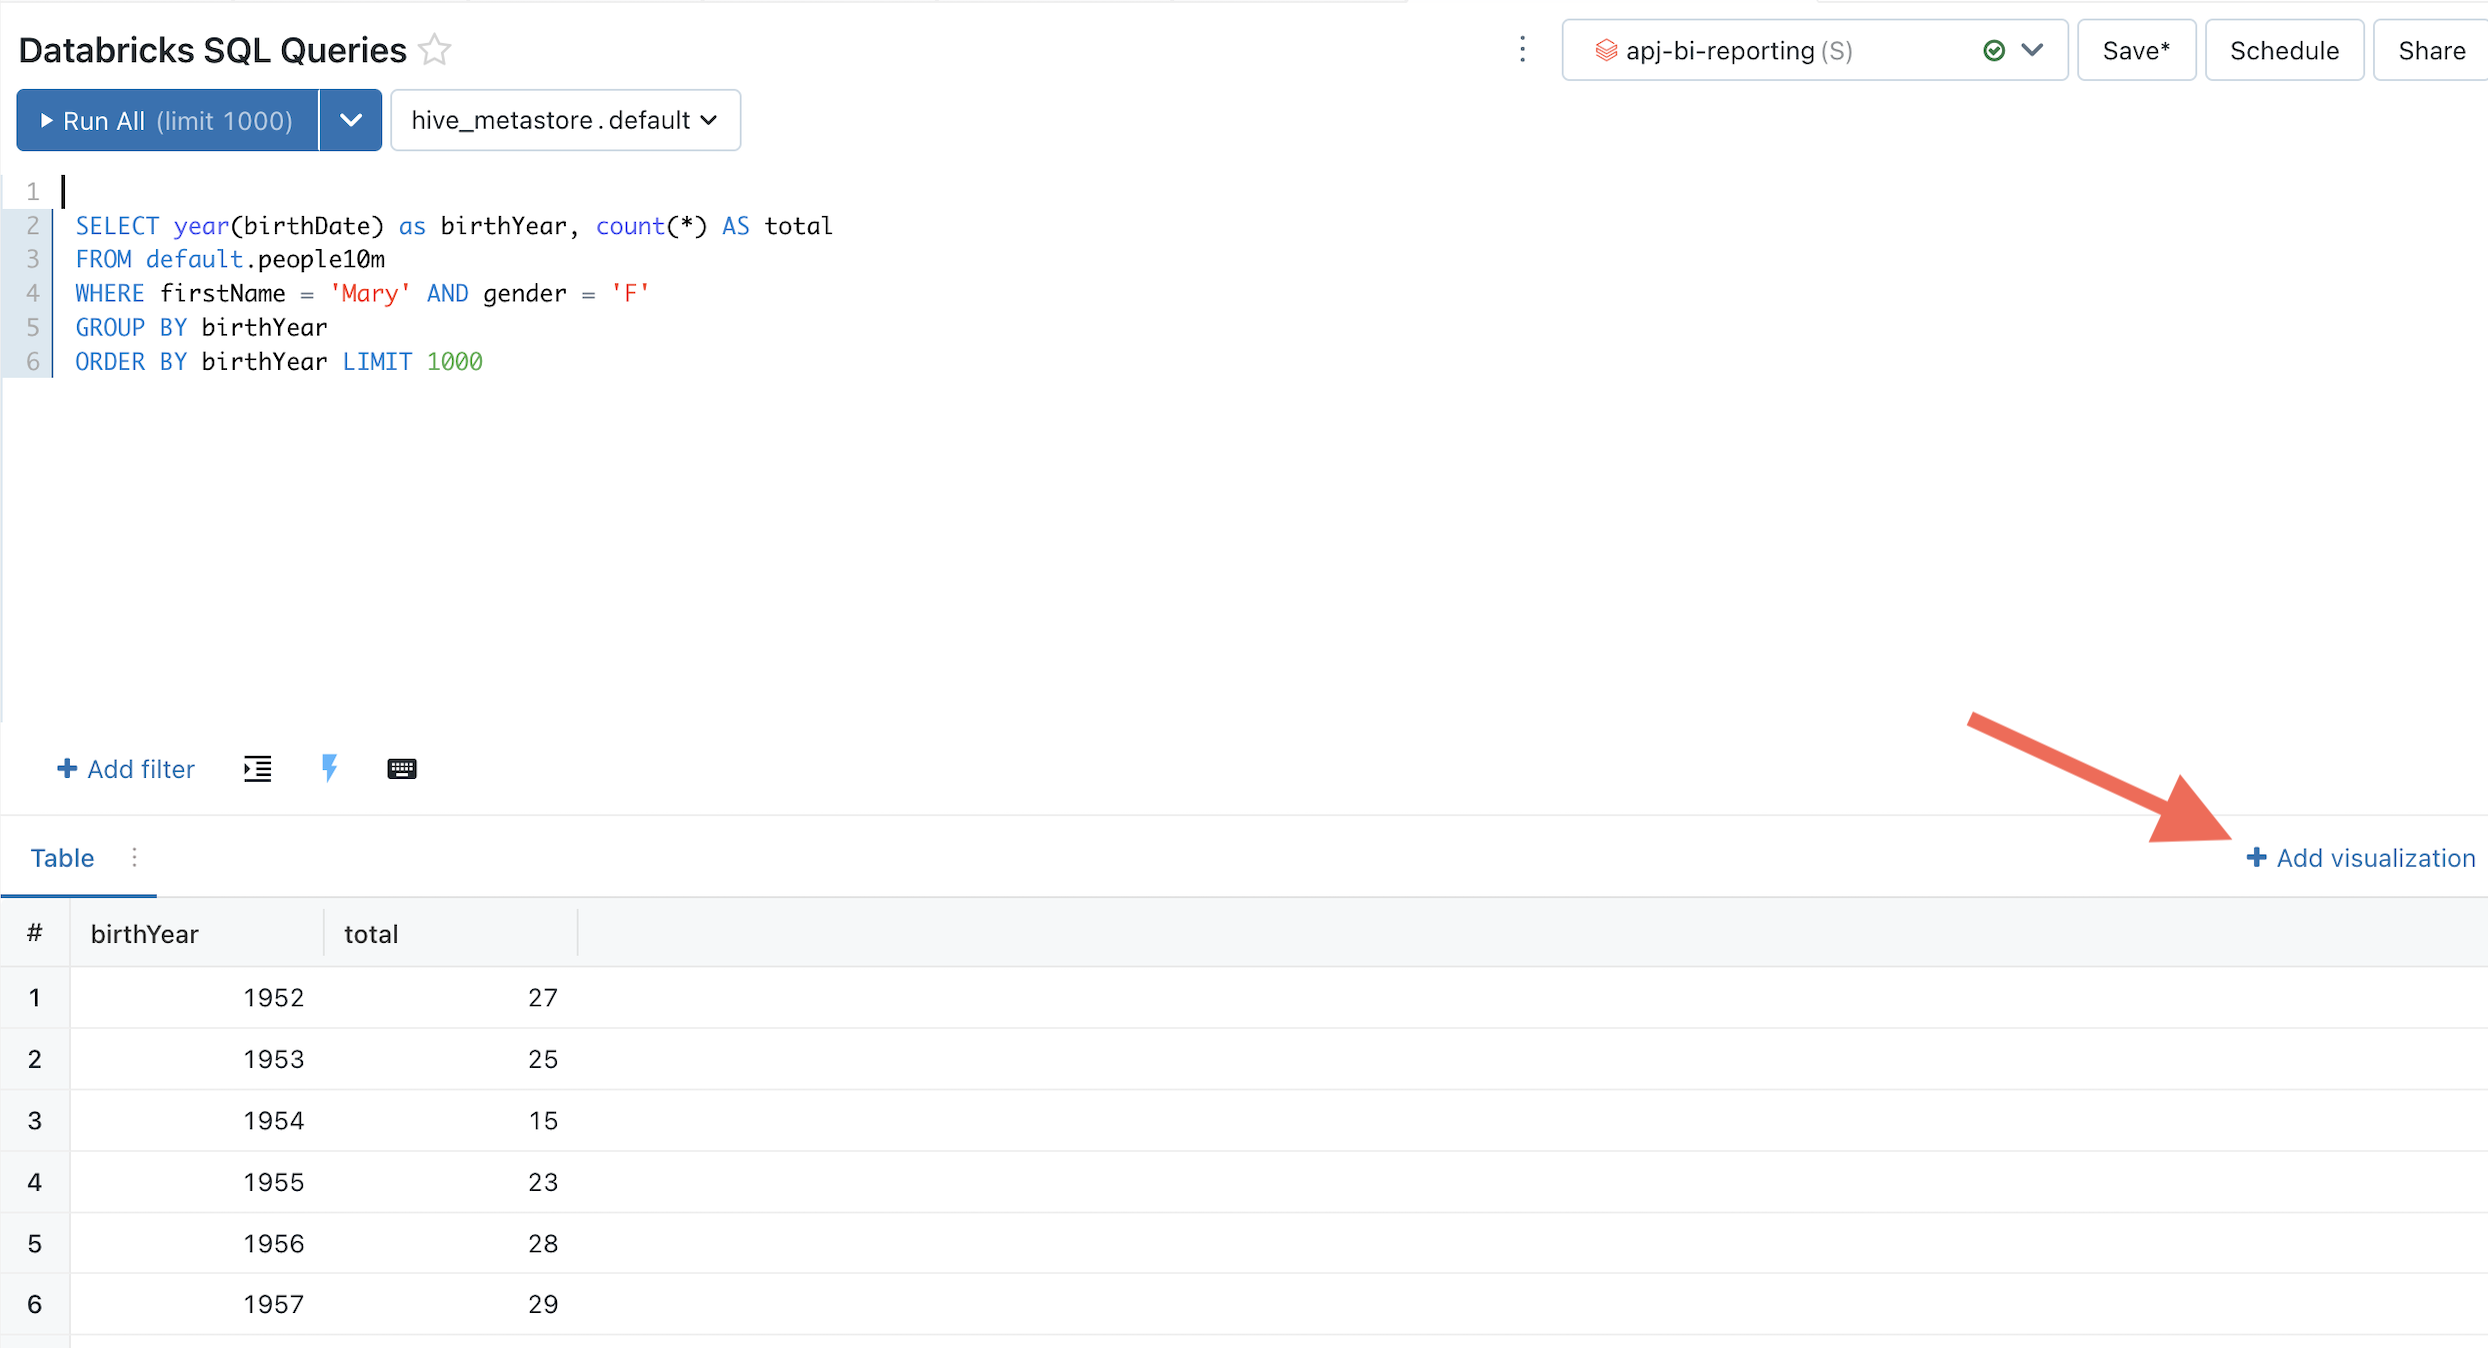
3. Bring your query to life with visualizations by selecting Add Visualization
where you will also choose your visualization type (scatter plot, heatmap,
histogram, etc) and customize to your liking

4. Integrate the queries and visualizations into a) a Databricks SQL built-in dashboard or b) a BI tool, such as Tableau, Power BI, or Hex with a few easy steps
a) Databricks SQL Built-in Dashboard
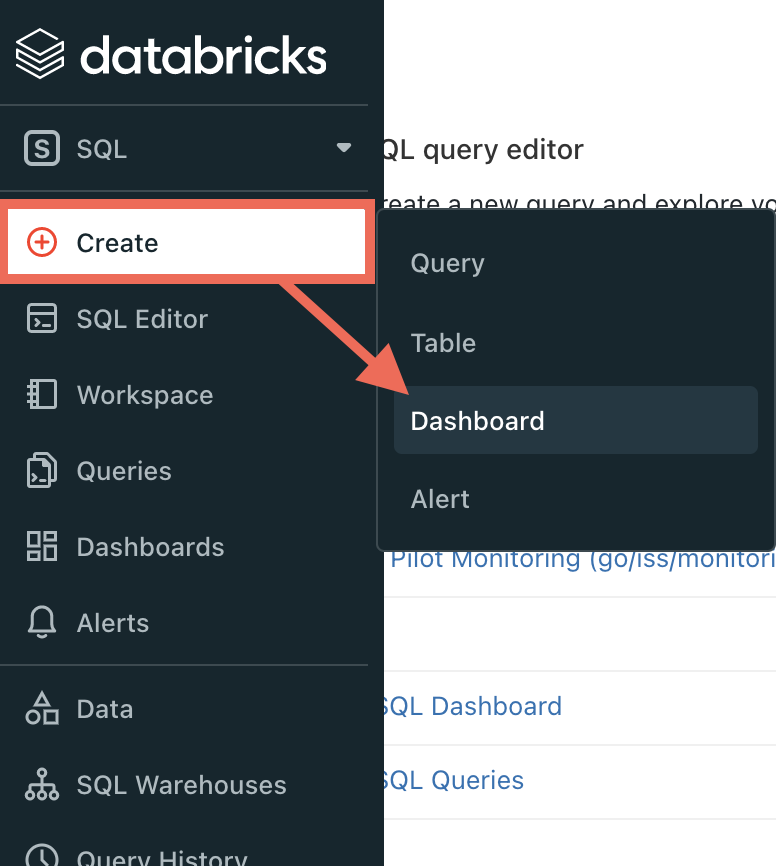
1) For a Databricks SQL dashboard, select Create and choose Dashboard

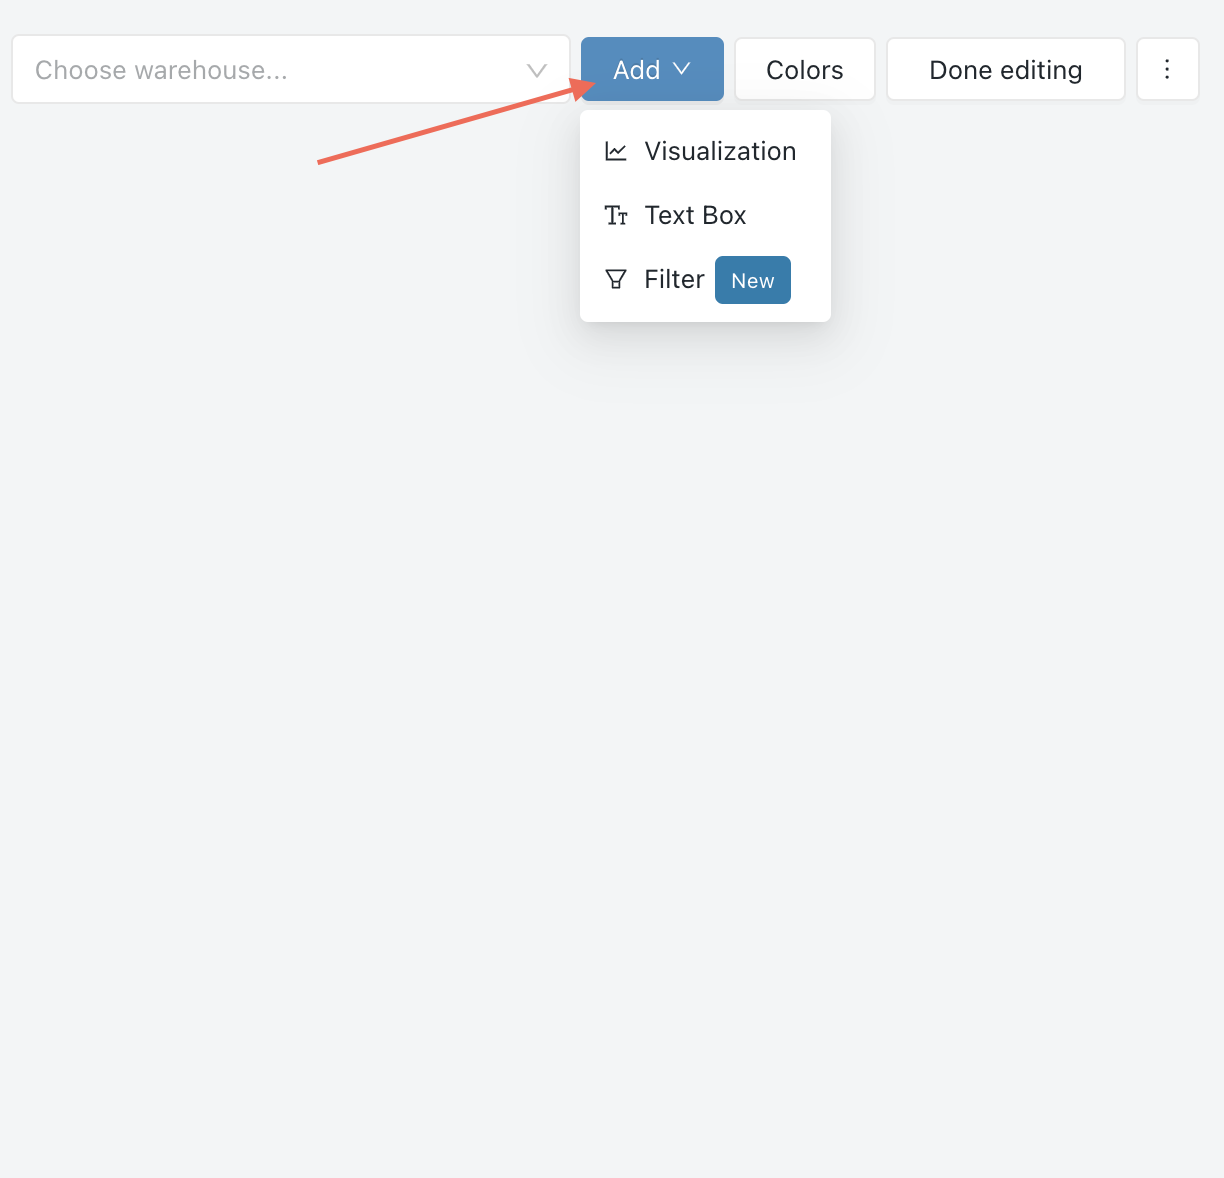
2) Connect to a SQL warehouse and customize your dashboard by clicking the "Add" dropdown and selecting Visualization or Text Box

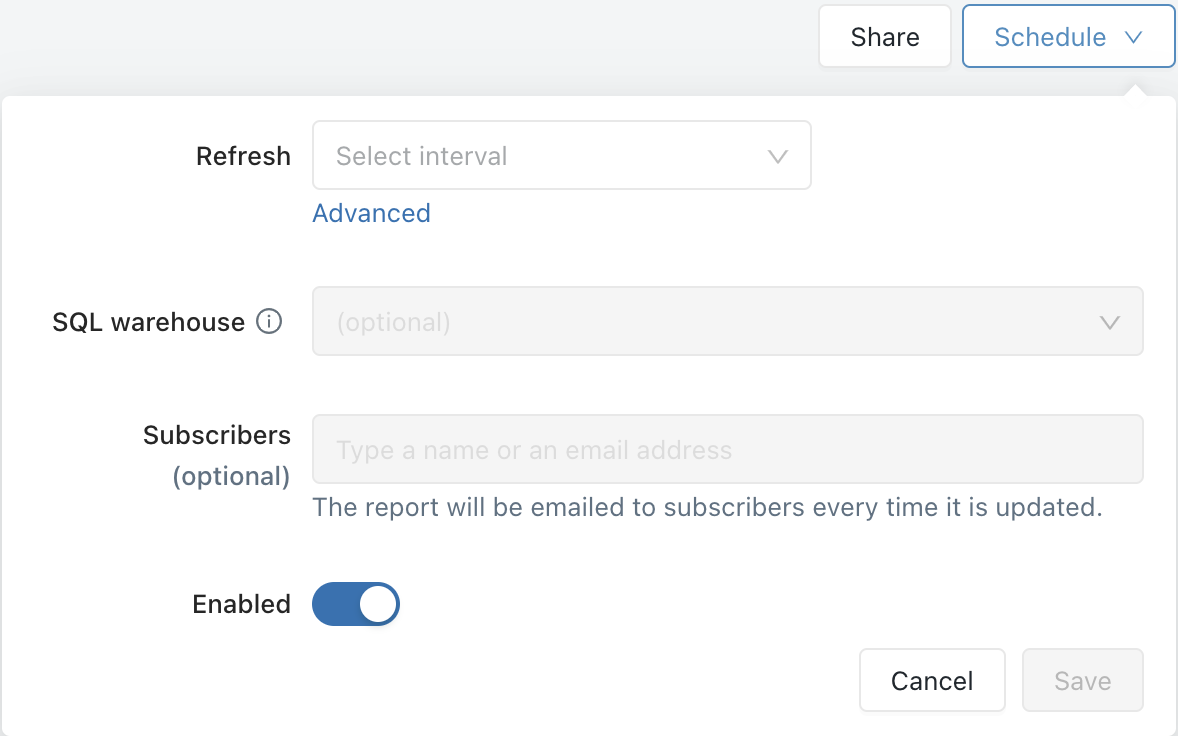
3) Automate your dashboard with the freshest data by clicking Schedule at
the top right of the dashboard

Note: Refresh schedules can only be set by a dashboard's owner and users with the "Can Edit" permission
b) Connect BI Tool
1. To connect your data to a BI tool, follow these steps or visit documentation for more information
2. Make sure your Databricks account, workspace and the signed-in user all meet the requirements for Partner Connect
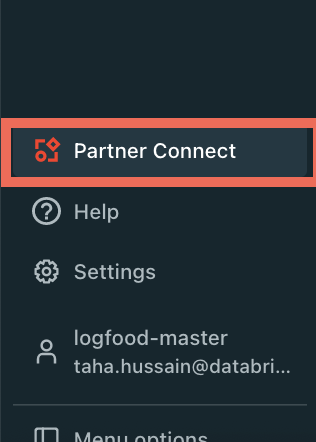
3. Go to the bottom of the sidebar and click Partner Connect

4. Click the tile for the partner that you want to connect your workspace with. If the tile has a checkmark icon, stop here, as your workspace is already connected. Otherwise, follow the on-screen directions to finish creating the connection.
• Note: Power BI Desktop, Tableau Desktop and other locally-installed applications do not display a checkmark icon, even after you connect your workspace to them
• Note: For the fastest connections, we often recommend using FiveTran for data ingestion
You are now ready to discover new business insights with the most complete and freshest data.
Learn more:
• Databricks Academy Introduction to creating queries, visualizations, and automated dashboards
• Documentation on queries, visualizations, and dashboards
• Databricks SQL demo highlighting SQL query editor, built-in data visualization tools, and flexible dashboarding and alerting capabilities
• Video Series on integrating tools through Partner Connect
• Feel free to contact us
Drop your questions, feedback and tips below!
Labels:
- Labels:
-
Bi
-
Databricks SQL
-
SQL
1 ACCEPTED SOLUTION
Accepted Solutions
Anonymous
Not applicable
Options
- Mark as New
- Bookmark
- Subscribe
- Mute
- Subscribe to RSS Feed
- Permalink
- Report Inappropriate Content
08-15-2022 11:41 PM
Thanks for the information, I will try to figure it out for more. Keep sharing such informative post keep suggesting such post.
2 REPLIES 2
Options
- Mark as New
- Bookmark
- Subscribe
- Mute
- Subscribe to RSS Feed
- Permalink
- Report Inappropriate Content
08-10-2022 09:05 AM
A good post with a detailed explanation.
Anonymous
Not applicable
Options
- Mark as New
- Bookmark
- Subscribe
- Mute
- Subscribe to RSS Feed
- Permalink
- Report Inappropriate Content
08-15-2022 11:41 PM
Thanks for the information, I will try to figure it out for more. Keep sharing such informative post keep suggesting such post.


Welcome to Databricks Community: Lets learn, network and celebrate together
Join our fast-growing data practitioner and expert community of 80K+ members, ready to discover, help and collaborate together while making meaningful connections.
Click here to register and join today!
Engage in exciting technical discussions, join a group with your peers and meet our Featured Members.
Related Content
- Alerts and Dashboard in Data Engineering
- Add Visualization in Notebook to Dashboard, how to set default add to Dashboard Bottom in Warehousing & Analytics
- Setting Date Range Picker to some default date in Data Engineering
- Parameters Passing to dataset in Databricks Lakeview Dashboard in Data Engineering
- pm4py no visualization in Warehousing & Analytics