- Mark as New
- Bookmark
- Subscribe
- Mute
- Subscribe to RSS Feed
- Permalink
- Report Inappropriate Content
03-24-2022 05:23 PM
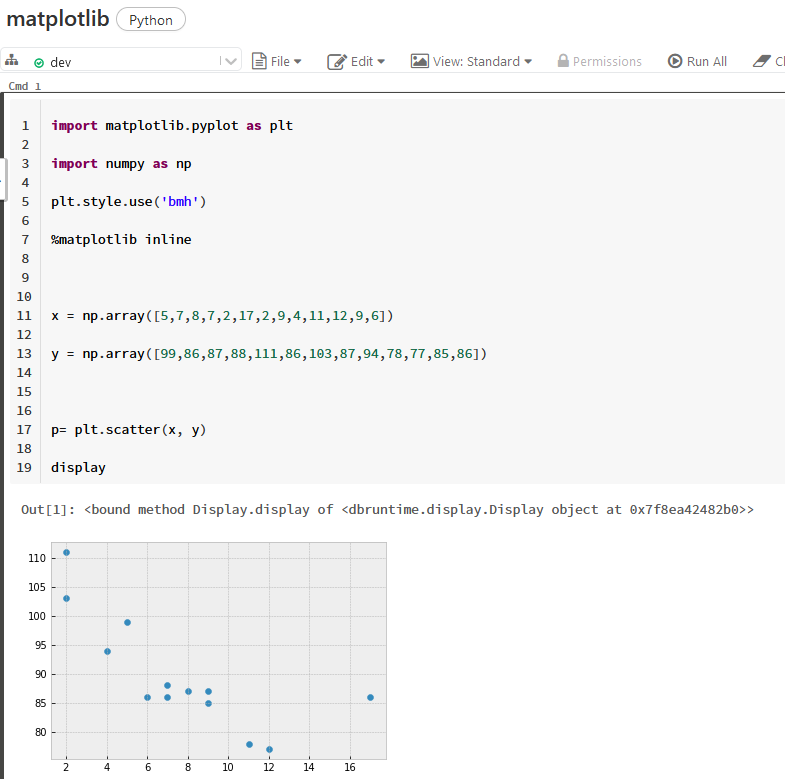
Hi , I have run this code
import matplotlib.pyplot as plt
import numpy as np
plt.style.use('bmh')
%matplotlib inline
x = np.array([5,7,8,7,2,17,2,9,4,11,12,9,6])
y = np.array([99,86,87,88,111,86,103,87,94,78,77,85,86])
p= plt.scatter(x, y)
display
command runs but no result is showing . I am using databricks 7.6 version any help will be greatly appreciated
- Labels:
-
Python
- Mark as New
- Bookmark
- Subscribe
- Mute
- Subscribe to RSS Feed
- Permalink
- Report Inappropriate Content
03-25-2022 03:22 AM
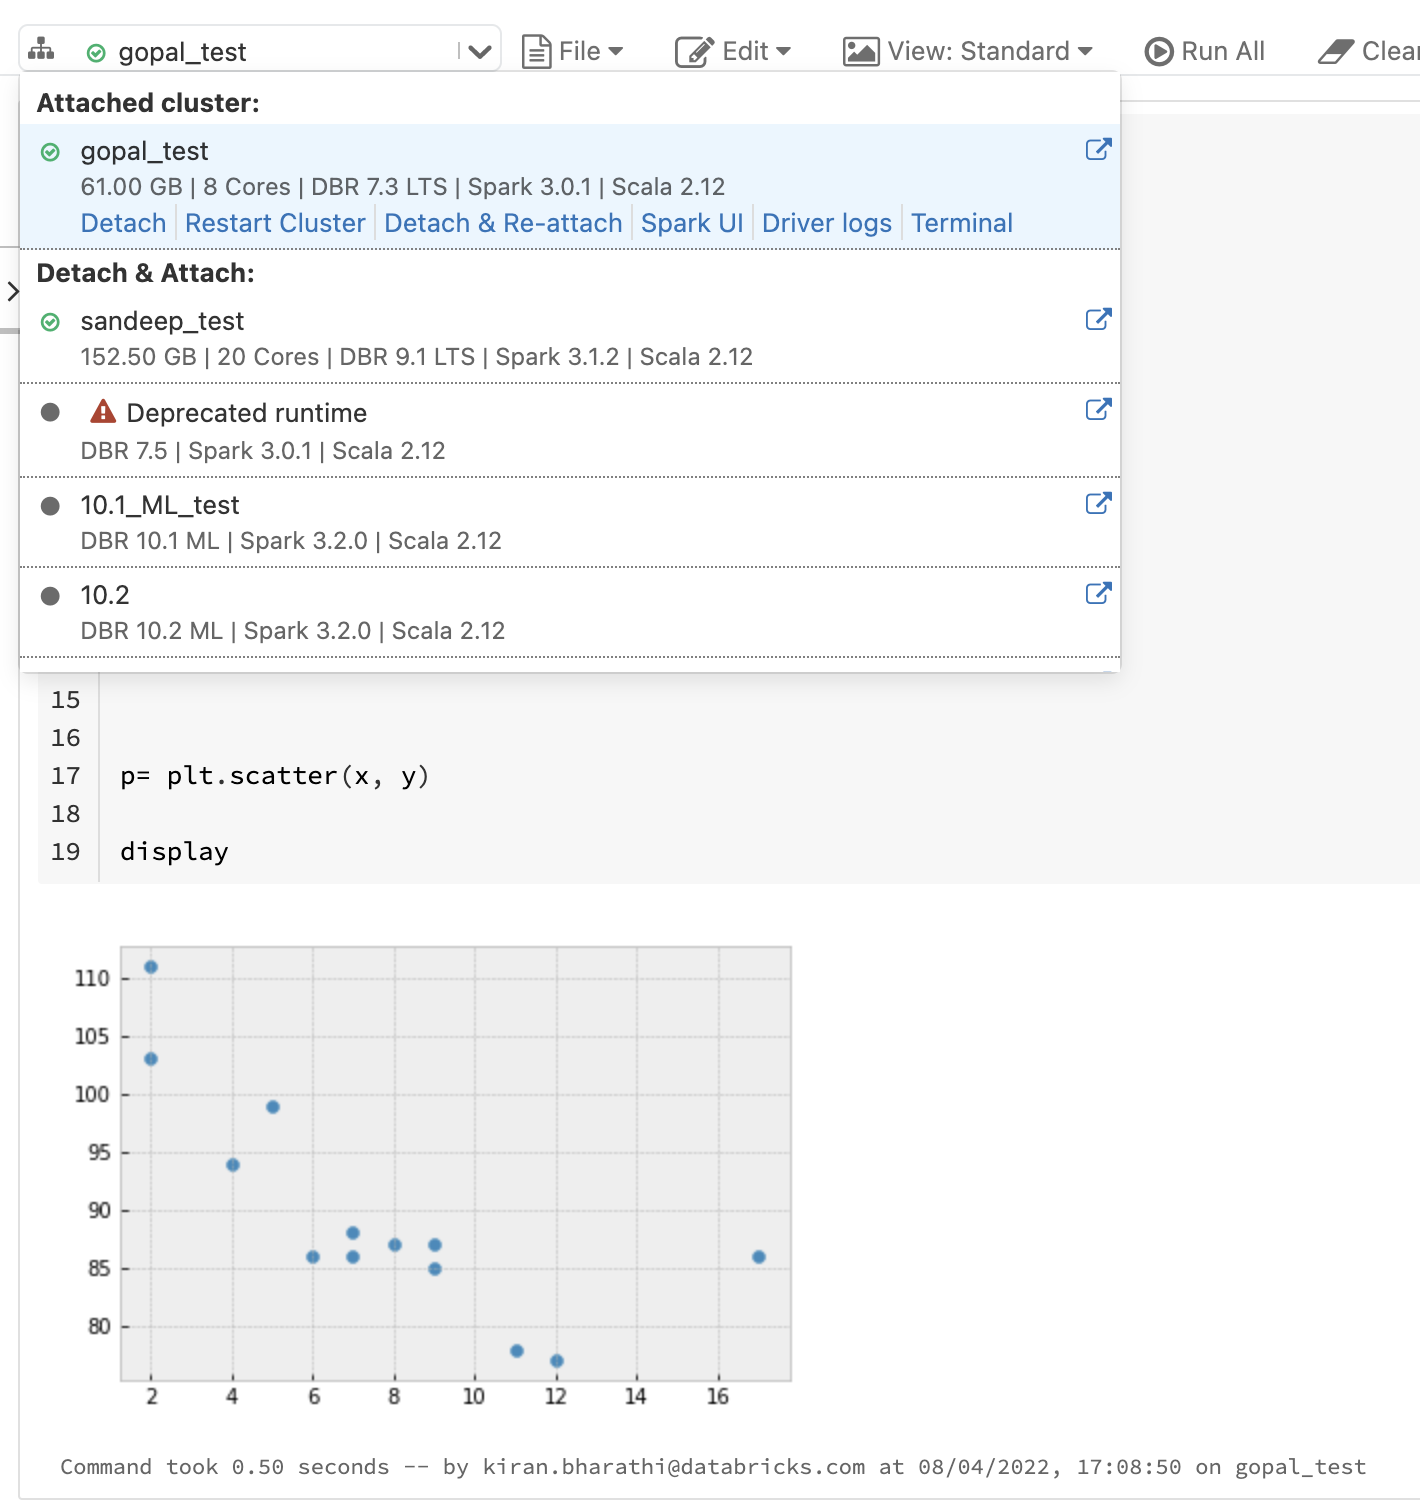
I think you need to upgrade runtime as I've just tested it and it worked like a charm 🙂

My blog: https://databrickster.medium.com/
- Mark as New
- Bookmark
- Subscribe
- Mute
- Subscribe to RSS Feed
- Permalink
- Report Inappropriate Content
03-25-2022 09:26 AM
can you please explain upgrade runtime? i again try the same command but it show nothing the command execute successfully
- Mark as New
- Bookmark
- Subscribe
- Mute
- Subscribe to RSS Feed
- Permalink
- Report Inappropriate Content
03-25-2022 09:42 AM
i am using 7.3 LTS ML (includes Apache Spark 3.0.1, Scala 2.12)
can you please tell which version are you using
- Mark as New
- Bookmark
- Subscribe
- Mute
- Subscribe to RSS Feed
- Permalink
- Report Inappropriate Content
03-25-2022 11:59 AM
I got it to work on 9.1 LTS
- Mark as New
- Bookmark
- Subscribe
- Mute
- Subscribe to RSS Feed
- Permalink
- Report Inappropriate Content
03-28-2022 07:01 AM
Great to hear. I was using 10.4
My blog: https://databrickster.medium.com/
- Mark as New
- Bookmark
- Subscribe
- Mute
- Subscribe to RSS Feed
- Permalink
- Report Inappropriate Content
04-08-2022 04:43 AM

- Mark as New
- Bookmark
- Subscribe
- Mute
- Subscribe to RSS Feed
- Permalink
- Report Inappropriate Content
04-25-2022 02:36 PM
Hi @Syed Ubaid ,
Just a friendly follow-up. Do you still need help or any of the responses from above help you to resolved your issues? Please let us know.
