Options
- Mark as New
- Bookmark
- Subscribe
- Mute
- Subscribe to RSS Feed
- Permalink
- Report Inappropriate Content
05-10-2023 01:21 AM
@Debayan Mukherjee
Thanks in advance.
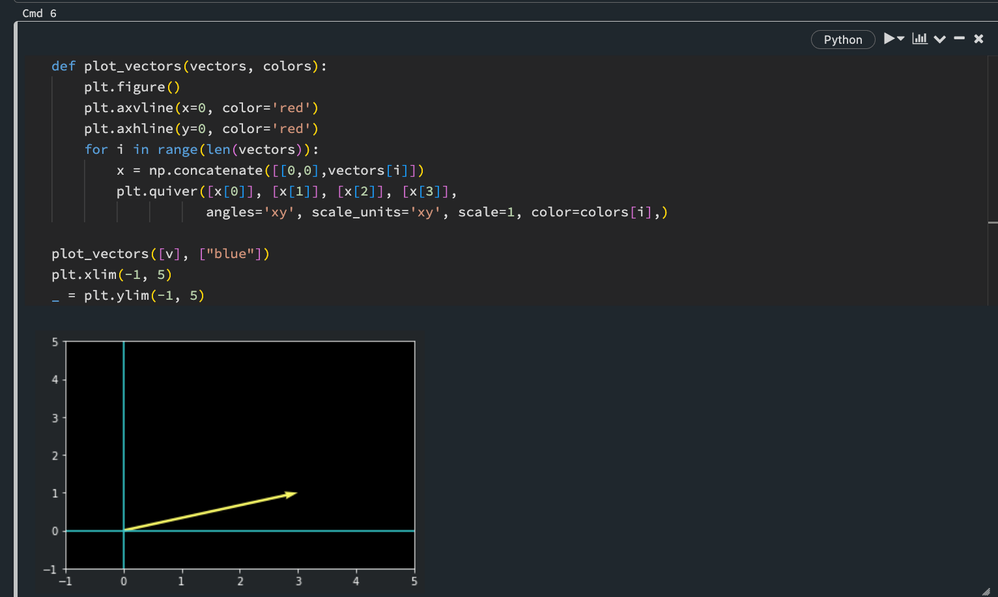
Below is a very simple example of the issue.
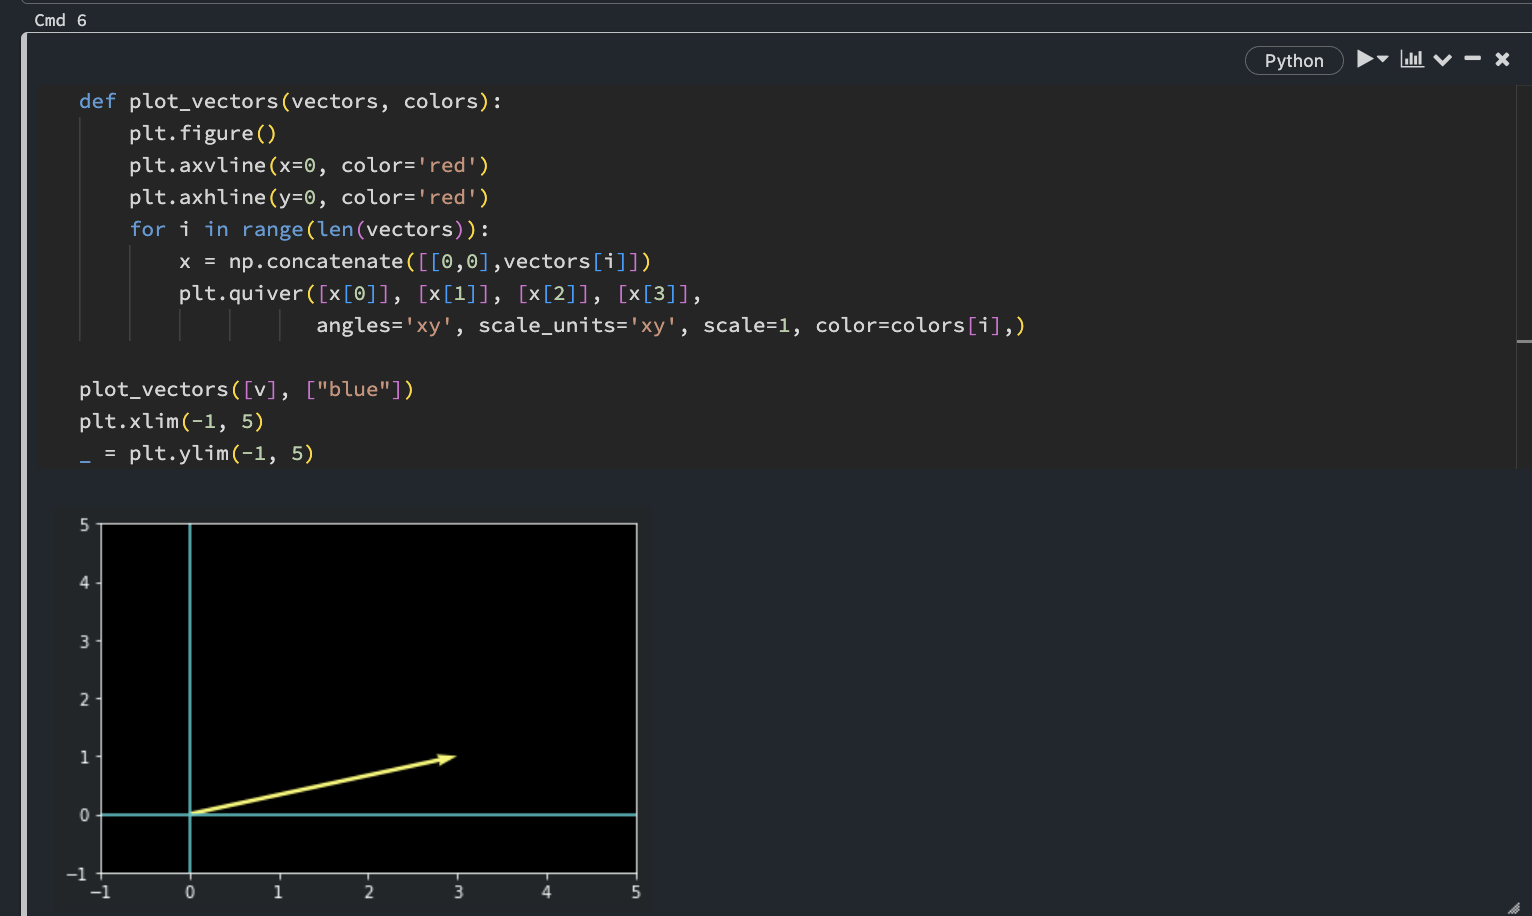
I denote the colors "red" for the axes and "blue" for the actual plot, but end up with teal colored axes and a yellow plot.
This is the same for any type of non-text output in the notebook environment, including images, which is the main cause of concern as it can make modeling and other tasks a bit confusing.
Not sure if there is a setting I missed, or if this is some kind of an issue.