Options
- Mark as New
- Bookmark
- Subscribe
- Mute
- Subscribe to RSS Feed
- Permalink
- Report Inappropriate Content
12-20-2022 05:47 AM
We have further analyzed the visualization problem and found two solutions.
The original visualization consists of 1 series and has aggregation enabled in the UI (but is unused, since the query itself aggregates already).
We found that the following two changes/workarounds solved the problem:
- Adding a 2nd series that visualizes a constant that uses a window function that repeats the desired ordering: "max(0) OVER (ORDER BY binSortUnit, binSortValue ASC) as constantWindowFunction"
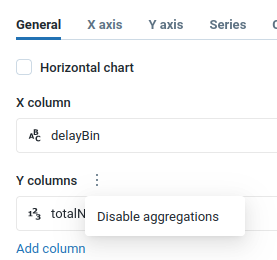
- Disabling aggregation in the UI: in the visualization edit window, on the "General" tab, click on the three vertical dots next to "Y columns" and click on "Disable aggregations"
The second solution is the easier one, obviously.

