Options
- Mark as New
- Bookmark
- Subscribe
- Mute
- Subscribe to RSS Feed
- Permalink
- Report Inappropriate Content
11-23-2021 10:04 AM
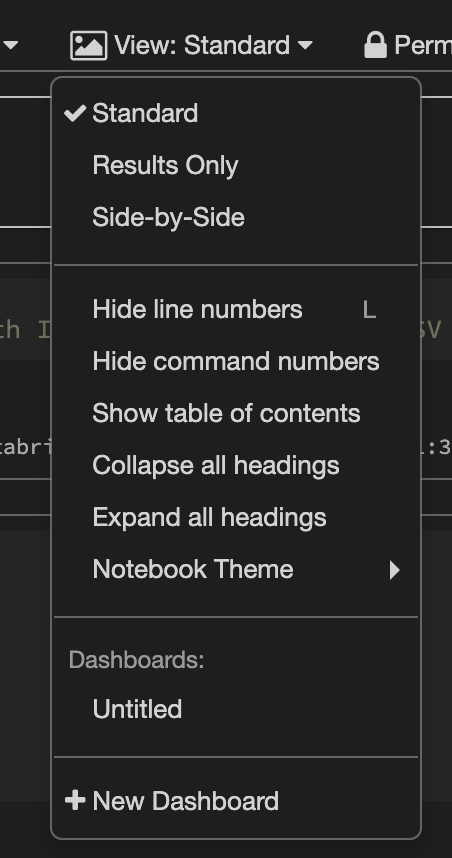
- Create a new Dashboard
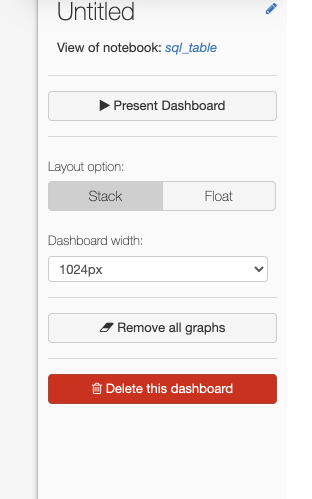
- You will find multiple chart or table displayed in the Dashboard. Click on remove all graphs to clear the Dashboard.
- To import all graphs from the notebook you can click on "Import all Graphs" which will be displayed on the Dashboard.
- If you want only a few graphs to be displayed then go to the notebook view.
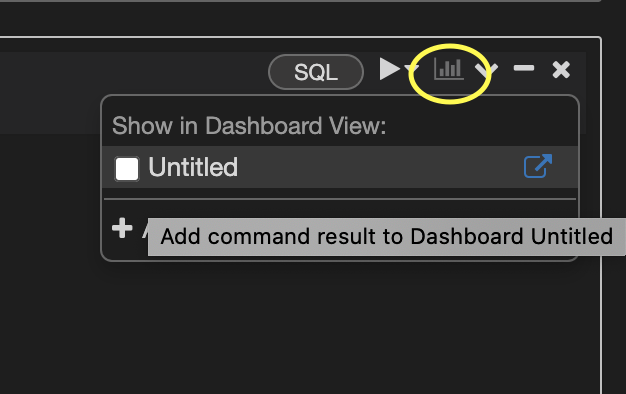
- If your command has a table or chart output, you can see the encircled symbol on the right corner of the cell.
- Click on that image that will give you the option to select it to show in your desired dashboard.
- You can go to the respective cells that you want to display in the Dashboard and add it to view in the Dashboard.