Options
- Mark as New
- Bookmark
- Subscribe
- Mute
- Subscribe to RSS Feed
- Permalink
- Report Inappropriate Content
11-23-2021 11:19 AM
could you please show me how?
I can only see the first plot in the dashboard. Note that I am NOT talking about showing the output of multiple cmds but multiple outputs of ONE cmd in a loop.
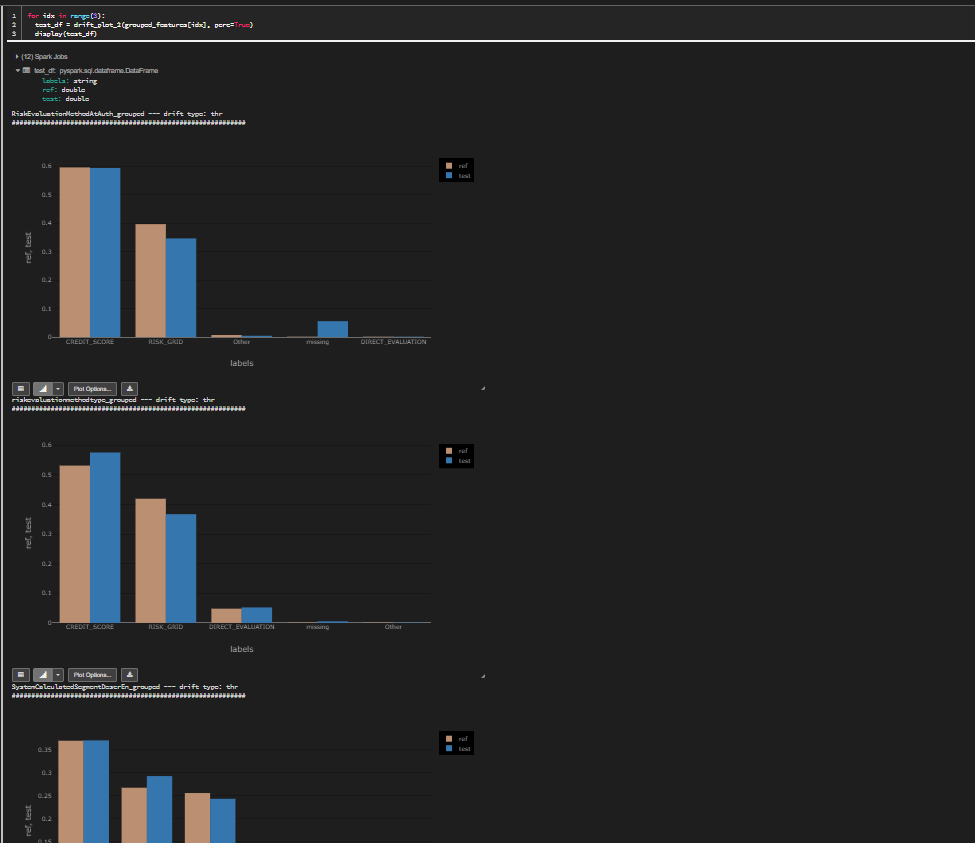
In the following code snippet, for each idx, I have one test_df for which I can see the result in the notebook but not when I create New Dashboard as you mentioned. In the New dashboard only the first plot is shown.
for idx in range(3):
  test_df = drift_plot_2(grouped_features[idx], perc=True)
  display(test_df)
Dashboard view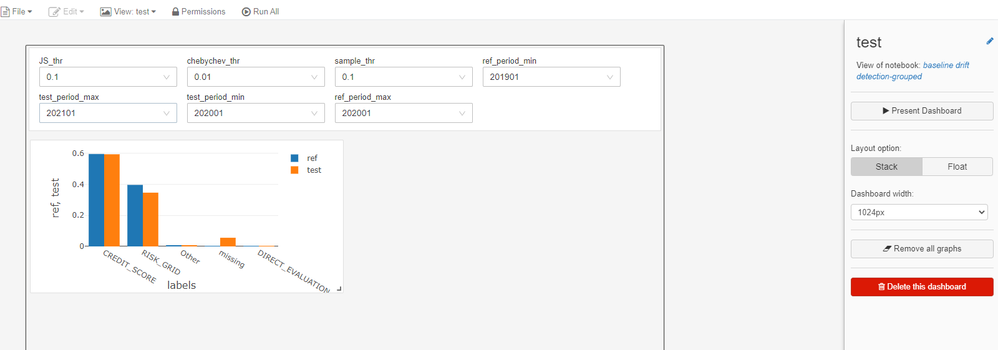
Notebook view