Question about monitoring driver memory utilization

- Mark as New
- Bookmark
- Subscribe
- Mute
- Subscribe to RSS Feed
- Permalink
- Report Inappropriate Content
06-21-2023 06:25 AM
Hi databricks/spark experts!
I have a piece on pandas-based 3rd party code that I need to execute as a part of a bigger spark pipeline. By nature, pandas-based code is executed on driver node. I ran into out of memory problems and started exploring the topic of monitoring driver node memory utilization.
My questions are:
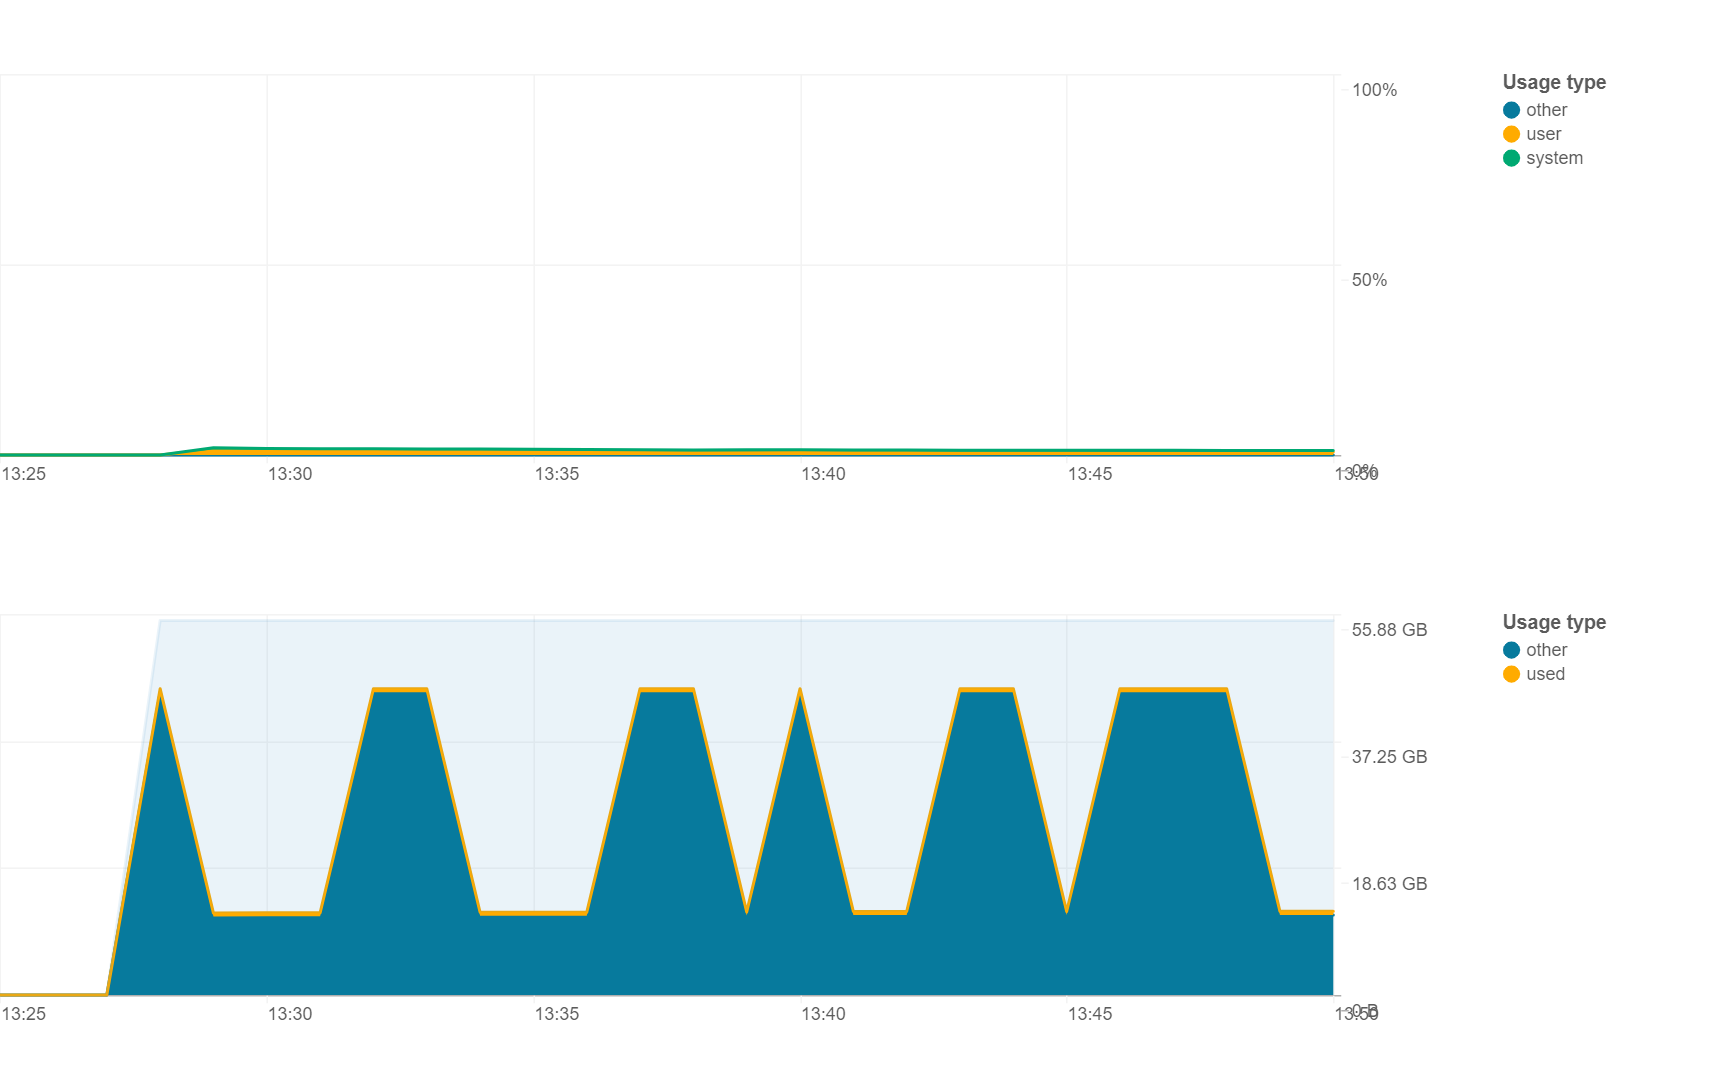
1) I have an idle cluster with 56Gb of RAM, and when looking at new "Metrics" I see weird memory fluctuations/cycles. Where do these cycles come from? The cluster is not running any code (CPU util ~0%) so I am wondering what's going on? 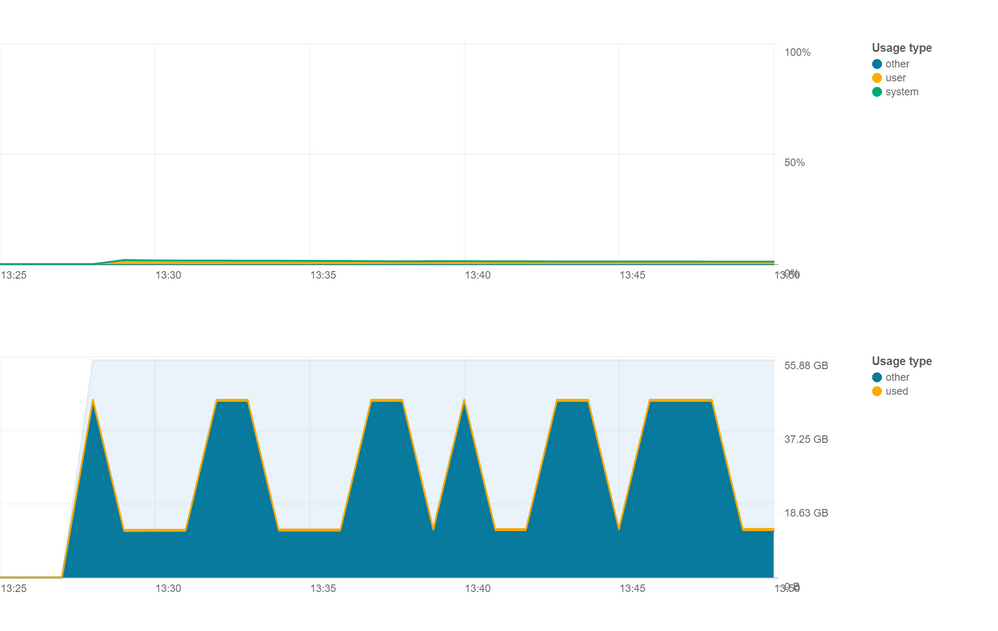
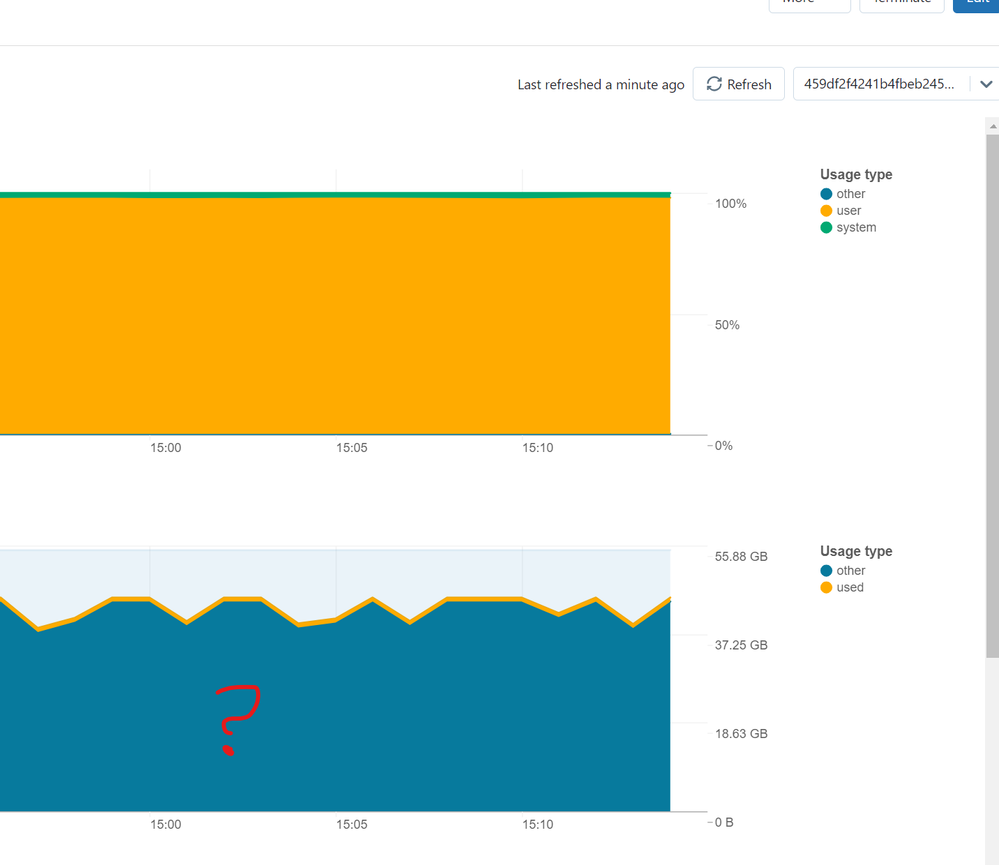
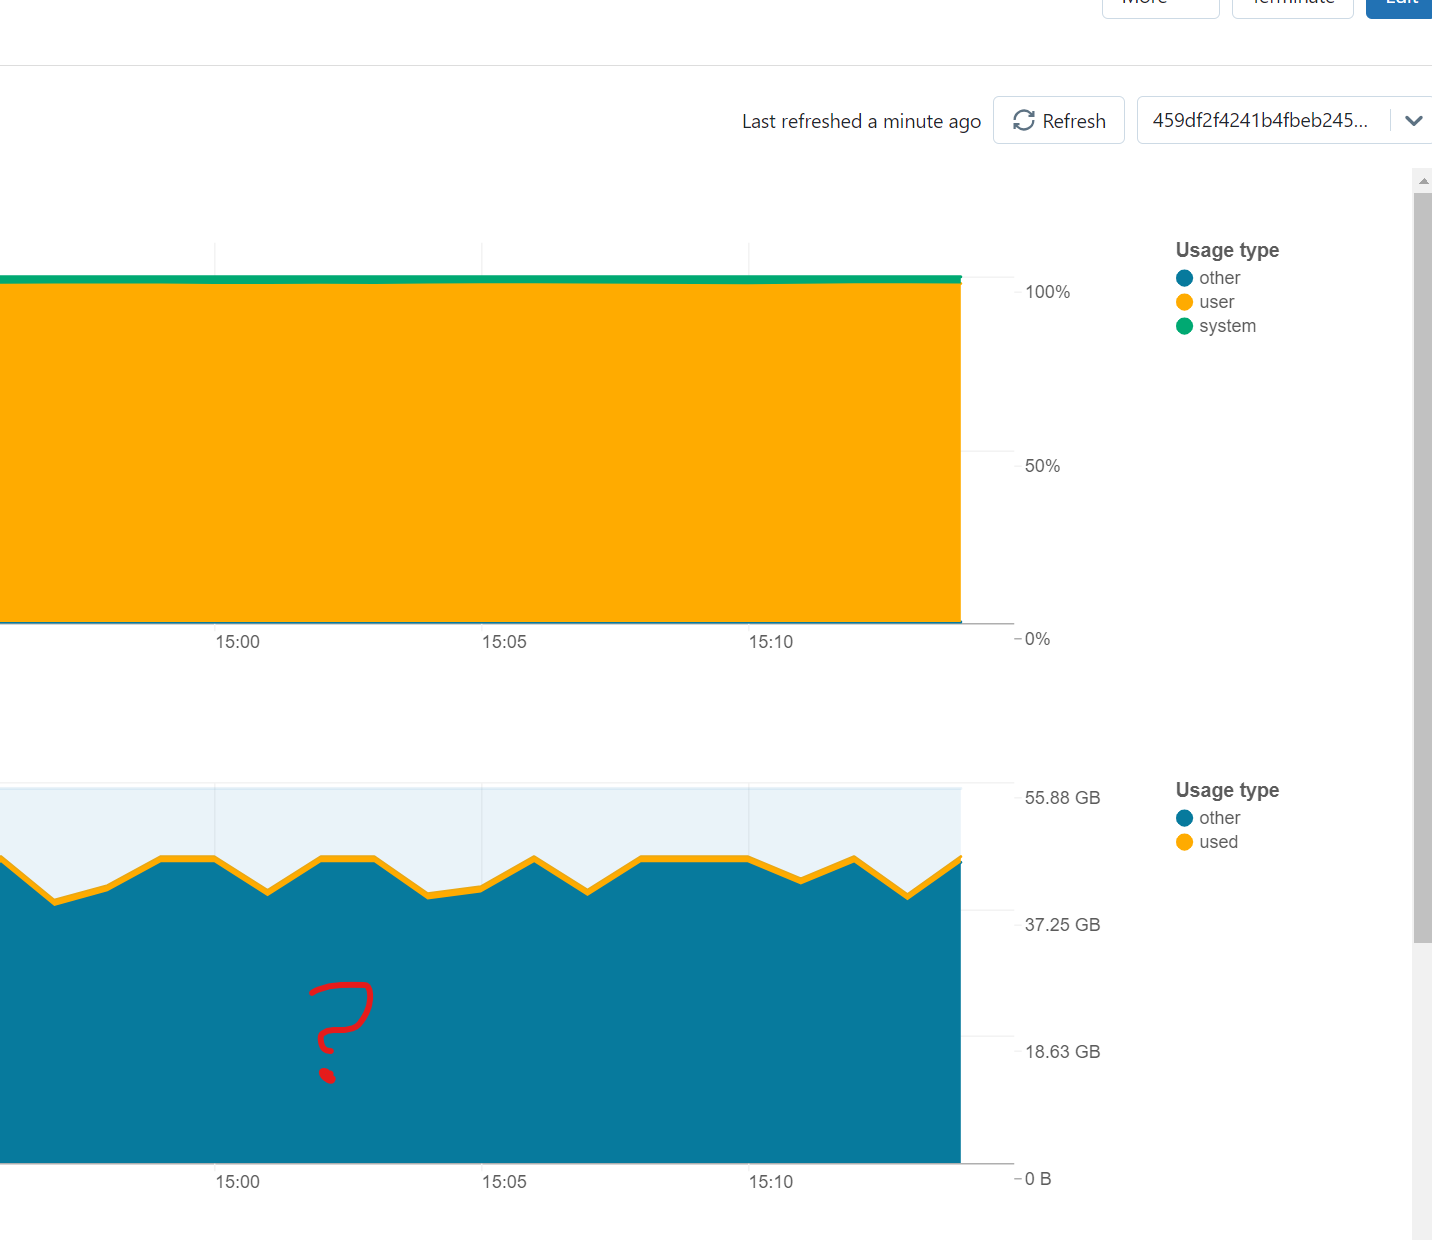
3) How does spark.driver.memory setting affects all that? Accrding to spark docs, by default it is 1g. Is this the max amount of memory that I can use when running my code ("used" series)? 1g seems extremally low. Would it make sense to increase it to 8 or 16g for my scenario?
Thx!