Visualizations from notebook keeps on disappearing
Options
- Mark as New
- Bookmark
- Subscribe
- Mute
- Subscribe to RSS Feed
- Permalink
- Report Inappropriate Content
09-29-2022 06:33 AM
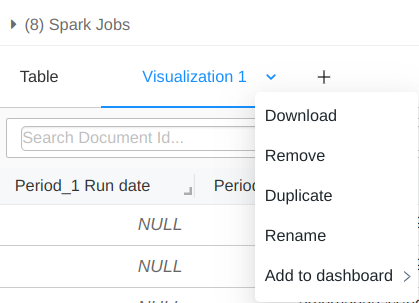
I have created a notebook which filters on the main table and generates bar graph. The graphs keeps on disappearing and sometimes they dont generate at all.
PFA. 'Visualization 1' has issues. Each time I run notebook manually, I have to build the graph and pin to the dashboard and rearrange them which seems arduous since I have atleast 15 different graphs

Labels:
- Labels:
-
Notebook
-
Visualizations
