- Mark as New
- Bookmark
- Subscribe
- Mute
- Subscribe to RSS Feed
- Permalink
- Report Inappropriate Content
03-11-2024 03:42 PM - edited 03-11-2024 03:47 PM
Hi!
Had really interesting results from some endpoint performance tests I did. I set up the non-optimized endpoint with zero-cluster scaling and optimized had this feature disabled.
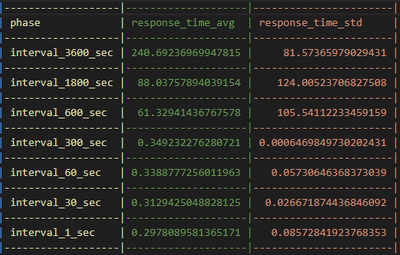
1) Why does the non-optimized endpoint have variable response time for 3600, 1800, and 600 seconds tests? If the serving cluster node scaled to 0 (due to no traffic) I would expect it to also require 240 seconds to start up and start serving again.
- what is going on behind the scenes that results in this?
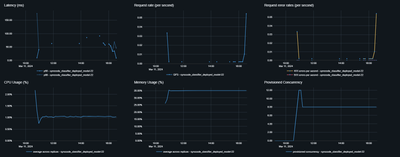
2) It was also interesting to see that the endpoint metrcs showed request error rates (top right graph). The endpoint didnt have any bad responses. Also the logs didnt show anything that would allude to this. Any idea why this would be the case? See blow for the metrics image.
3) I didnt find much information on this on the databricks documentation. Any additional documentation would be appreicated! Happy to sync with the team
non-optimized endpoint results
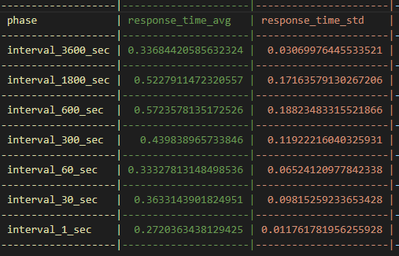
optimized endpoint results
metrics log: