
Options
- Mark as New
- Bookmark
- Subscribe
- Mute
- Subscribe to RSS Feed
- Permalink
- Report Inappropriate Content
03-04-2026 04:51 AM
Hi @a_d - Thanks for confirming.
Here is a good example.
I've also tested it and given some snapshots below if it helps. My data looks something like the below.
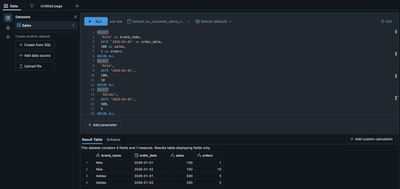
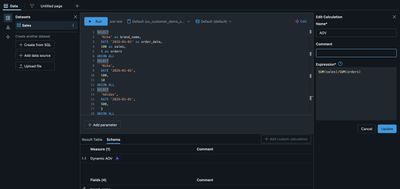
You can see above the results (on the right side) an option to create a custom calculation. In the editor, add the formula. SUM(sales) / SUM(orders)
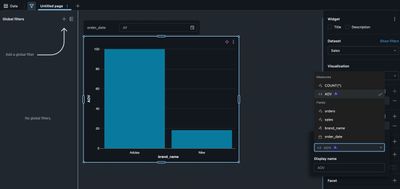
You can then build the visualisation and choose the custom measure you have created.
Hope that helps!
If this answer resolves your question, could you mark it as “Accept as Solution”? That helps other users quickly find the correct fix.
Regards,
Ashwin | Delivery Solution Architect @ Databricks
Helping you build and scale the Data Intelligence Platform.
***Opinions are my own***
Ashwin | Delivery Solution Architect @ Databricks
Helping you build and scale the Data Intelligence Platform.
***Opinions are my own***
