Engage in discussions on data warehousing, analytics, and BI solutions within the Databricks Community. Share insights, tips, and best practices for leveraging data for informed decision-making.
Here's your Data + AI Summit 2024 - Warehousing & Analytics recap as you use intelligent data warehousing to improve performance and increase your organization’s productivity with analytics, dashboards and insights.
Keynote: Data Warehouse presente...
Hi Team, I have analysts set up in Databricks with the "Databricks SQL access" entitlement who are no longer able to create a new Dashboard on their own and just getting a blank page when they try. The API response to their create dashboard request i...
In databricks documentation it says that there's a display name when creating dashboard variables but I'm not seeing it in the dashboard settings. Does anyone know where to find them?
Hi everyone,I have a question about the best practice for organizing Databricks Asset Bundles.I have multiple projects, and each project has its own notebooks and jobs.Is it recommended to:create a single bundle that includes all projects, orcreate a...
You can create Bundles that are decoupled by domain, managed via multi target declarations within configuration and also driven by immutable, versioned artifacts stored securely within Unity Catalog Volumes. You can rely on explicit CI/CD gating and ...
Hi @Hubert-Dudek I am getting following error: METRIC_VIEW_WINDOW_FUNCTION_NOT _SUPPORTED The metric view is not allowed to use window function (...) With the following definition:- name: Sales net Total- expr: SUM(MEASURE(`Sales net`)) OVER())Howeve...
When trying to download the public domain seismic data of Equinor’s Volve field (https://www.equinor.com/energy/volve-data-sharing) using a browser (Edge or Chrome) this fails after 2 hours due to network errors. Resuming only provides once off relie...
I have a few questions about AI/BI Dashboards:Is there a way to create nested tabs (tabs within tabs), or are dashboards limited to a single level of page navigation?For dashboards with many visualizations, what is the recommended approach to improve...
You can follow below1. Nested Tabs - AIBI dashboards are currently limited to a single level of page navigation. You cannot create nested tabs. Each dashboard can have multiple pages that appear as tabs at the top, but those pages cannot themselves ...
Hi, i have an error with the excel pluging.It was working fine until today. I can login and browse the catalog but I get an error when trying to query any data. It seems like its sending in a blank warehouse id. I have choosen a warehouse and its run...
Hi All,
Just wanted to provide a proper answer to this thread. This was a known bug on Databricks' side, a recent UI infrastructure change caused the Excel Add-In to send a blank warehouseId in query requests, even though the warehouse was properly...
Does combo chart have group by color function by specific field (type)? Like Line Chart: the line will perfectly split into multiple lines of different colors, with each line representing a distinct Type.Bar Chart: The original single bar will also ...
Hi @emily02,
No. You can't. Combo charts in AI/BI Dashboards do not support Tableau-style grouping by a categorical field such as Type. That means a combo chart can combine bar and line series and colour by metric series, but it will not automaticall...
I created an iceberg table within databricks and shared it via delta sharing with tokenThen I use curl command to access it with iceberg endpoint like this:curl -X GET \-H "Authorization: Bearer ***"\-H "Accept: application/json" \"https://ohio.cloud...
Thank you @rdokala , @aleksandra_ch BTW, can I share managed uniformed delta table to external Iceberg clients? I tried this but get the same error, my friend tried, seems fine. I don't know what's the difference.Best regards,Li
Excel suddenly started automatically formatting data (convert everything to text) when loading from the new Azure Databricks Excel plug-in. I can still see my default formatting in the Databricks sideload. Just wondering if this behaviour was caused...
I'm trying to implement a percent of total measure in pivot table. I succeeded in creating a measure using the below formula.However, I want this measure to recognize global filter selections. For example, I want to show emissions share by category. ...
Hi @amekojc,
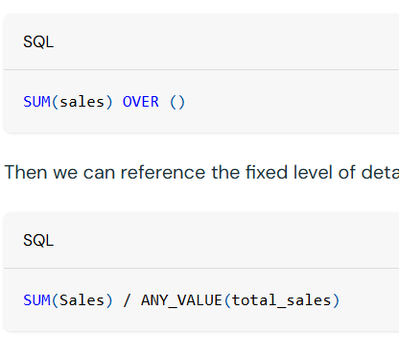
The approach in your screenshot is the fixed LOD pattern, where you first define a total such as SUM(emissions) OVER () and then divide the grouped value by that total. That approach works for a basic per cent-of-total calculation, but i...
Hi, I try to embed my dashboard in Databricks Notebook as some_html = """
<iframe
src="...."
width="100%"
height="600"
frameborder="0">
</iframe>
"""
displayHTML(some_html) then I get an error of the form: This dashboard is unavailablePlease...
Hi @vvanag,
What you’re trying to do is understandable, but I wouldn’t recommend embedding an AI/BI dashboard back into a Databricks notebook with displayHTML and a raw iframe.
The documented embedding path for AI/BI Dashboards is to embed them in an...
The below code works fine in Colab/VSCodium/JupyterNotebookimport ipywidgets as widgets
from IPython.display import display, HTML
output = widgets.Output()
with output:
display(HTML(some_html))
outputBut it does not work in Databrickstestme.ht...
Hi @vvanag,
What you’re seeing is expected to some extent in Databricks Notebooks.
Databricks supports ipywidgets, but it doesn’t guarantee full Jupyter or Colab parity, and there are a few documented limitations on how widgets render and behave in n...
I was wondering if anyone has been able to display totals in a Table/Pivot visualization? Similar to what is possible in other BI tools?If I have a table with a bunch of rows and one of the columns is Total Cost, I want to be able to show a Total at ...
Hi,Is there a way to add a grand total to a table visualisation in a Databricks dashboard, based on the latest updates?In a pivot table, I can add a grand total row; however, the issue is that doing so compromises the sorting functionality.
Hi,We're building an automated data quality testing framework for AI/BI (Lakeview) dashboards. Our goal is to validate that dashboard widgets display correct data without using UI automation (Selenium/Playwright don't work reliably due to React dynam...
Thanks for u detailed answer on the dashboard validation testing. Hi,We also need to perform performance testing and concurrency testing of AI/BI (Lakeview) dashboards at the browser level — measuring actual page load times, time-to-interactive, and ...