Engage in discussions on data warehousing, analytics, and BI solutions within the Databricks Community. Share insights, tips, and best practices for leveraging data for informed decision-making.
Here's your Data + AI Summit 2024 - Warehousing & Analytics recap as you use intelligent data warehousing to improve performance and increase your organization’s productivity with analytics, dashboards and insights.
Keynote: Data Warehouse presente...
Hello everyone,I am using a DAB to send a dashboard snapshots to notification destinations.The intended design is to use a For each task for multiple team/destination pairs. As a minimal test, I am iterating over an array containing one notification ...
dashboard_task.subscription.subscribers[].destination_id does not appear to support Lakeflow dynamic value references such as {{input}} or {{input.destination_id}}. Public docs show dynamic values for For each inputs and nested task parameters, and d...
I have a requirement to build a custom designed quality dashboard in dbx. The requirement is like user have to view the quality of data metrics in a single dahsboard for many tables, irrespective of viewing it via inbuilt data quality option availabl...
Hi @Databricks2206, For us we have try a couple of approachesOption 1: DQX (Databricks Labs Data Quality Framework) - this is purpose-built for what you're describing. It ships a pre-built dashboard with three tabs, including a "Data Quality Summary"...
I would like to be able to add columns to this overview, if possible. For example, the latency of the model is available, when I click on a run, but I would like to see the average latency, similarly to, how the score is shown. Of course, I could add...
I don’t think the evaluation runs overview currently supports adding custom columns or directly displaying existing metrics like latency percentiles/medians. The usual workaround is to create custom scores or export the evaluation data and analyze it...
Hello community of DatabricksI need some help over a specific issue in AI/BI Dashboard filteringMy current dashboard has 2 widgets:- A map containing the shopID and it's current GPS location- A table showing all the available shopID with some metadat...
Table widgets in AI/BI dashboards don't support cross-filtering, that's what's tripping you up. Click-to-filter currently only works for bar, box plot, heatmap, histogram, pie, scatter, and point map visualizations. A plain table isn't in that list, ...
We are looking to create a Genie usage report covering natural language querying activity across three channels — the Genie One web app, Genie One Teams app, and Genie One mobile app. The report is intended to surface insights around user activity, q...
1. Is there a system table for this today?
Answer: not as a single supported system table. Databricks system tables currently give you usage/billing, audit events, and executed SQL history, but not a complete per-message record containing the origina...
Hi Team, I have analysts set up in Databricks with the "Databricks SQL access" entitlement who are no longer able to create a new Dashboard on their own and just getting a blank page when they try. The API response to their create dashboard request i...
Hello, Thank you both for your responses. @Ashwin_DSA, I had an analyst test again and they were able to create a dashboard; looks like the hotfix worked. Thank you for your team's prompt attention to this matter. Sincerely, Matthew
Hi everyone,I have a question about the best practice for organizing Databricks Asset Bundles.I have multiple projects, and each project has its own notebooks and jobs.Is it recommended to:create a single bundle that includes all projects, orcreate a...
You can create Bundles that are decoupled by domain, managed via multi target declarations within configuration and also driven by immutable, versioned artifacts stored securely within Unity Catalog Volumes. You can rely on explicit CI/CD gating and ...
Hi @Hubert-Dudek I am getting following error: METRIC_VIEW_WINDOW_FUNCTION_NOT _SUPPORTED The metric view is not allowed to use window function (...) With the following definition:- name: Sales net Total- expr: SUM(MEASURE(`Sales net`)) OVER())Howeve...
When trying to download the public domain seismic data of Equinor’s Volve field (https://www.equinor.com/energy/volve-data-sharing) using a browser (Edge or Chrome) this fails after 2 hours due to network errors. Resuming only provides once off relie...
I have a few questions about AI/BI Dashboards:Is there a way to create nested tabs (tabs within tabs), or are dashboards limited to a single level of page navigation?For dashboards with many visualizations, what is the recommended approach to improve...
You can follow below1. Nested Tabs - AIBI dashboards are currently limited to a single level of page navigation. You cannot create nested tabs. Each dashboard can have multiple pages that appear as tabs at the top, but those pages cannot themselves ...
Hi, i have an error with the excel pluging.It was working fine until today. I can login and browse the catalog but I get an error when trying to query any data. It seems like its sending in a blank warehouse id. I have choosen a warehouse and its run...
Hi All,
Just wanted to provide a proper answer to this thread. This was a known bug on Databricks' side, a recent UI infrastructure change caused the Excel Add-In to send a blank warehouseId in query requests, even though the warehouse was properly...
Does combo chart have group by color function by specific field (type)? Like Line Chart: the line will perfectly split into multiple lines of different colors, with each line representing a distinct Type.Bar Chart: The original single bar will also ...
Hi @emily02,
No. You can't. Combo charts in AI/BI Dashboards do not support Tableau-style grouping by a categorical field such as Type. That means a combo chart can combine bar and line series and colour by metric series, but it will not automaticall...
Excel suddenly started automatically formatting data (convert everything to text) when loading from the new Azure Databricks Excel plug-in. I can still see my default formatting in the Databricks sideload. Just wondering if this behaviour was caused...
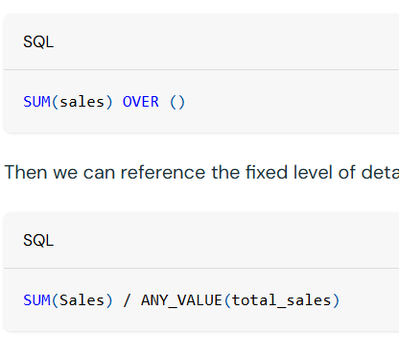
I'm trying to implement a percent of total measure in pivot table. I succeeded in creating a measure using the below formula.However, I want this measure to recognize global filter selections. For example, I want to show emissions share by category. ...
Hi @amekojc,
The approach in your screenshot is the fixed LOD pattern, where you first define a total such as SUM(emissions) OVER () and then divide the grouped value by that total. That approach works for a basic per cent-of-total calculation, but i...
Hi, I try to embed my dashboard in Databricks Notebook as some_html = """
<iframe
src="...."
width="100%"
height="600"
frameborder="0">
</iframe>
"""
displayHTML(some_html) then I get an error of the form: This dashboard is unavailablePlease...
Hi @vvanag,
What you’re trying to do is understandable, but I wouldn’t recommend embedding an AI/BI dashboard back into a Databricks notebook with displayHTML and a raw iframe.
The documented embedding path for AI/BI Dashboards is to embed them in an...