Turn on suggestions
Auto-suggest helps you quickly narrow down your search results by suggesting possible matches as you type.
Showing results for
Data Engineering
Turn on suggestions
Auto-suggest helps you quickly narrow down your search results by suggesting possible matches as you type.
Showing results for
- Databricks
- Data Engineering
- How to display SHAP plots?
Options
- Subscribe to RSS Feed
- Mark Topic as New
- Mark Topic as Read
- Float this Topic for Current User
- Bookmark
- Subscribe
- Mute
- Printer Friendly Page
Options
- Mark as New
- Bookmark
- Subscribe
- Mute
- Subscribe to RSS Feed
- Permalink
- Report Inappropriate Content
02-13-2019 11:29 AM
I am looking to display SHAP plots, here is the code:
import xgboost import shapshap.initjs() # load JS visualization code to notebookX,y = shap.datasets.boston() # train XGBoost model
model = xgboost.train({"learning_rate": 0.01}, xgboost.DMatrix(X, label=y), 100)
explainer = shap.TreeExplainer(model) # explain the model's predictions using SHAP values
shap_values = explainer.shap_values(X)
shap_explain = shap.force_plot(explainer.expected_value, shap_values[0,:], X.iloc[0,:]) # visualize the first prediction's explanation
displayHTML(shap_explain.data) # display plot
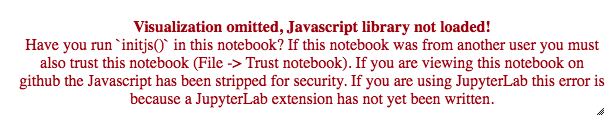
However I am receiving the following error:

Any help greatly appreciated!
Labels:
- Labels:
-
Display
-
Displayhtml
-
Sf Username
-
Shap
1 ACCEPTED SOLUTION
Accepted Solutions
Options
- Mark as New
- Bookmark
- Subscribe
- Mute
- Subscribe to RSS Feed
- Permalink
- Report Inappropriate Content
02-17-2019 10:26 PM
I was finally able to plot them in DataBricks without js
shap_display = shap.force_plot(explainer.expected_value[1], shap_value[1], feat_x.iloc[0, :], matplotlib=True)display(shap_display)
5 REPLIES 5
Options
- Mark as New
- Bookmark
- Subscribe
- Mute
- Subscribe to RSS Feed
- Permalink
- Report Inappropriate Content
02-17-2019 10:26 PM
I was finally able to plot them in DataBricks without js
shap_display = shap.force_plot(explainer.expected_value[1], shap_value[1], feat_x.iloc[0, :], matplotlib=True)display(shap_display)
Options
- Mark as New
- Bookmark
- Subscribe
- Mute
- Subscribe to RSS Feed
- Permalink
- Report Inappropriate Content
01-06-2020 10:23 PM
It is quite good but only works for a single explanation. If you want to apply to multiple samples, force_plot has not been supported yet as in Jan 2020.
Options
- Mark as New
- Bookmark
- Subscribe
- Mute
- Subscribe to RSS Feed
- Permalink
- Report Inappropriate Content
02-21-2019 07:27 AM
It also needs to be run on an earlier version of matplotlib
matplotlib: 1.5.3
Options
- Mark as New
- Bookmark
- Subscribe
- Mute
- Subscribe to RSS Feed
- Permalink
- Report Inappropriate Content
06-18-2019 06:21 PM
For what it's worth, I got force plots to work in Databricks by copying the bundle.js Javascript from the SHAP package into a hidden cell in the notebook. See https://databricks.com/blog/2019/06/17/detecting-bias-with-shap.html and the notebook that accompanies it.
Options
- Mark as New
- Bookmark
- Subscribe
- Mute
- Subscribe to RSS Feed
- Permalink
- Report Inappropriate Content
02-05-2020 08:07 AM
As @Vinh dqvinh87 noted, the accepted solution only works for
force_plot. For other plots, the following trick works for me:
import matplotlib.pyplot as plt
p = shap.summary_plot(shap_values, test_df, show=False)
display(p)
Announcements


Welcome to Databricks Community: Lets learn, network and celebrate together
Join our fast-growing data practitioner and expert community of 80K+ members, ready to discover, help and collaborate together while making meaningful connections.
Click here to register and join today!
Engage in exciting technical discussions, join a group with your peers and meet our Featured Members.
Related Content
- How to display shap waterfall plot in Data Engineering
- Bokeh plotting with ipywidgets or in Databricks Dashboard in Data Engineering
- Partial Dependency Plots from AutoML in Machine Learning
- Responsible AI on Databricks in Machine Learning
- How do I configure plot options through the `display` function as code (not through the interactive UI)? in Data Engineering