help undersanding RAM utilization graph
- Mark as New
- Bookmark
- Subscribe
- Mute
- Subscribe to RSS Feed
- Permalink
- Report Inappropriate Content
03-17-2025 04:01 PM
I am trying to understand the following graph databricks is showing me and failing:
What is that constant lightly shaded area close to 138GB? It is not explained in the "Usage type" legend. The job is running completely on the driver node, not utilizing any of the Spark worker nodes, it's just a Python script. I know that memory usage of ~138GB is real because job was failing on a 128GB driver node and seems to be happy on 256GB driver.
- Mark as New
- Bookmark
- Subscribe
- Mute
- Subscribe to RSS Feed
- Permalink
- Report Inappropriate Content
03-17-2025 10:47 PM
Hi @meshko
The light-shaded area represents the total available RAM size. The tooltip shows it when you hover over a mouse.
- Mark as New
- Bookmark
- Subscribe
- Mute
- Subscribe to RSS Feed
- Permalink
- Report Inappropriate Content
03-17-2025 10:53 PM
So why does the totail available RAM want to go above 128GB if the graph never gets above 90GB?
- Mark as New
- Bookmark
- Subscribe
- Mute
- Subscribe to RSS Feed
- Permalink
- Report Inappropriate Content
03-17-2025 11:30 PM
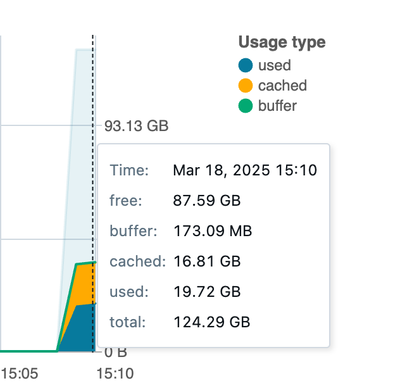
@meshko , I think you are seeing RAM uses of a 128GB RAM instance. Is that correct? Could you confirm the instance type of your cluster node? Although the screenshot you attached in the first message seemed to have reached almost 139GB, I guess you will see about 128GB in total in the tooltip if it is a 128GB RAM instance.
I just tested a single 128GB RAM instance, and the RAM chart shows this.
- Mark as New
- Bookmark
- Subscribe
- Mute
- Subscribe to RSS Feed
- Permalink
- Report Inappropriate Content
03-21-2025 07:09 PM
The screenshot was from 256GB instance. What i am trying understand it this:
On 128GB instance the job was failing. On 256GB instance it is succeeding but never gets above 50GB. So, why was it failing on 128GB instance?