cancel
Showing results forย 
Search instead forย 
Did you mean:ย 
Data Engineering
Join discussions on data engineering best practices, architectures, and optimization strategies within the Databricks Community. Exchange insights and solutions with fellow data engineers.
cancel
Showing results forย 
Search instead forย 
Did you mean:ย 

Databricks with CloudWatch metrics without Instanceid dimension

dceman
New Contributor

I have jobs running on job clusters. And I want to send metrics to the CloudWatch. I set CW agent followed this guide.

But issue is that I can't create useful metrics dashboard and alarms because I always have InstanceId dimension, and InstanceId is different on every job run. If you check the link above, you will find init script and part of the json for configuring cw agent is

{
    ...
    "append_dimensions": {
        "InstanceId": "${aws:InstanceId}"
    }

I removed this, and added custom dimension to each metric, something like this

{
    "agent": {
        "metrics_collection_interval": 10,
        "logfile": "/var/log/amazon-cloudwatch-agent.log",
        "omit_hostname": true,
        "debug": true
    },
    "logs": {
        "logs_collected": {
            "files": {
                "collect_list": [
                    {
                        "file_path": "/databricks/spark/work/*/*/stderr",
                        "log_group_name": "/databricks/$NAMESPACE",
                        "log_stream_name": "executor-stderr"
                    },
                    {
                        "file_path": "/databricks/spark/work/*/*/stdout",
                        "log_group_name": "/databricks/$NAMESPACE",
                        "log_stream_name": "executor-stdout"
                    }
                ]
            }
        }
    },
    "metrics": {
        "namespace": "$NAMESPACE",
        "metrics_collected": {
            "statsd": {
                "service_address": ":8125"
            },
            "cpu": {
                "resources": [
                    "*"
                ],
                "measurement": [
                    {
                        "name": "cpu_usage_idle",
                        "rename": "EXEC_CPU_USAGE_IDLE",
                        "unit": "Percent"
                    },
                    {
                        "name": "cpu_usage_iowait",
                        "rename": "EXEC_CPU_USAGE_IOWAIT",
                        "unit": "Percent"
                    },
                    {
                        "name": "cpu_time_idle",
                        "rename": "EXEC_CPU_TIME_IDLE",
                        "unit": "Percent"
                    },
                    {
                        "name": "cpu_time_iowait",
                        "rename": "EXEC_CPU_TIME_IOWAIT",
                        "unit": "Percent"
                    }
                ],
                "totalcpu": true,
                "append_dimensions": {
                    "node": "$EXECUTOR_ID"
                }
            },
            "disk": {
                "resources": [
                    "/"
                ],
                "measurement": [
                    {
                        "name": "disk_free",
                        "rename": "EXEC_DISK_FREE",
                        "unit": "Gigabytes"
                    },
                    {
                        "name": "disk_inodes_free",
                        "rename": "EXEC_DISK_INODES_FREE",
                        "unit": "Count"
                    },
                    {
                        "name": "disk_inodes_total",
                        "rename": "EXEC_DISK_INODES_TOTAL",
                        "unit": "Count"
                    },
                    {
                        "name": "disk_inodes_used",
                        "rename": "EXEC_DISK_INODES_USED",
                        "unit": "Count"
                    }
                ],
                "append_dimensions": {
                    "node": "$EXECUTOR_ID"
                }
            },
            "diskio": {
                "resources": [
                    "*"
                ],
                "measurement": [
                    {
                        "name": "diskio_iops_in_progress",
                        "rename": "EXEC_DISKIO_IOPS_IN_PROGRESS",
                        "unit": "Megabytes"
                    },
                    {
                        "name": "diskio_read_time",
                        "rename": "EXEC_DISKIO_READ_TIME",
                        "unit": "Megabytes"
                    },
                    {
                        "name": "diskio_write_time",
                        "rename": "EXEC_DISKIO_WRITE_TIME",
                        "unit": "Megabytes"
                    }
                ],
                "append_dimensions": {
                    "node": "$EXECUTOR_ID"
                }
            },
            "mem": {
                "measurement": [
                    {
                        "name": "mem_available",
                        "rename": "EXEC_MEM_AVAILABLE",
                        "unit": "Megabytes"
                    },
                    {
                        "name": "mem_total",
                        "rename": "EXEC_MEM_TOTAL",
                        "unit": "Megabytes"
                    },
                    {
                        "name": "mem_used",
                        "rename": "EXEC_MEM_USED",
                        "unit": "Megabytes"
                    },
                    {
                        "name": "mem_used_percent",
                        "rename": "EXEC_MEM_USED_PERCENT",
                        "unit": "Megabytes"
                    },
                    {
                        "name": "mem_available_percent",
                        "rename": "EXEC_MEM_AVAILABLE_PERCENT",
                        "unit": "Megabytes"
                    }
                ],
                "append_dimensions": {
                    "node": "$EXECUTOR_ID"
                }
            },
            "net": {
                "resources": [
                    "eth0"
                ],
                "measurement": [
                    {
                        "name": "net_bytes_recv",
                        "rename": "EXEC_NET_BYTES_RECV",
                        "unit": "Bytes"
                    },
                    {
                        "name": "net_bytes_sent",
                        "rename": "EXEC_NET_BYTES_SENT",
                        "unit": "Bytes"
                    }
                ],
                "append_dimensions": {
                    "node": "$EXECUTOR_ID"
                }
            }
        }
    }
}

and similar json in case init script is running on driver. In that case dimension is like

"append_dimensions": {
                    "node": "driver"
                }

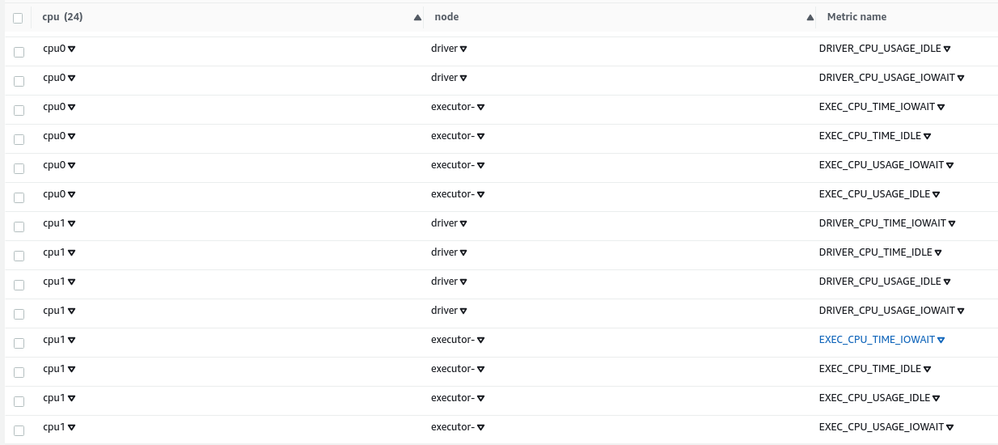
I would like to have end result something like this
image 

but as you can see, I'm missing executor number sufix.

I tried to parse this env

EXECUTOR_ID="executor-$(echo $SPARK_LOG_URL_STDOUT | cut -f2 -d'&' | cut -f2 -d'=')"

but seems that I don't have this variable on executors.

Could you please suggest how to get executorId in init bash script? Is there some useful env variable I can get from executors?

Why this is important to us?

We will have a lot of jobs running every 1h. After job run, jobs cluster will be terminated.

In that case Dimension InstanceId is not useful because every time it will be different, and metrics would be not much useful.

Maybe I could use CW Metrics Query to group by InstanceId, but it's not possible to set alarm on CW Query.

0 REPLIES 0

Connect with Databricks Users in Your Area

Join a Regional User Group to connect with local Databricks users. Events will be happening in your city, and you wonโ€™t want to miss the chance to attend and share knowledge.

If there isnโ€™t a group near you, start one and help create a community that brings people together.

Request a New Group