- Mark as New
- Bookmark
- Subscribe
- Mute
- Subscribe to RSS Feed
- Permalink
- Report Inappropriate Content
08-04-2022 12:19 PM
Hello, I am trying to use Metrics and Ganglia UI to monitor the state of my clusters better. But, I am seeing that the visuals are not coming up. I have tried opening on Chrome and microsoft edge, it shows same. Is there something that I need to install to get it working?
Accepted Solutions
- Mark as New
- Bookmark
- Subscribe
- Mute
- Subscribe to RSS Feed
- Permalink
- Report Inappropriate Content
08-04-2022 12:37 PM
No additional software is required to be installed. Mostly this could be a slow network issue. Please gather the HAR file and check if you see any errors in that.
- Mark as New
- Bookmark
- Subscribe
- Mute
- Subscribe to RSS Feed
- Permalink
- Report Inappropriate Content
08-04-2022 12:37 PM
No additional software is required to be installed. Mostly this could be a slow network issue. Please gather the HAR file and check if you see any errors in that.
- Mark as New
- Bookmark
- Subscribe
- Mute
- Subscribe to RSS Feed
- Permalink
- Report Inappropriate Content
09-07-2022 04:35 AM
Hi @Pritesh Patel
Hope all is well! Just wanted to check in if you were able to resolve your issue and would you be happy to share the solution or mark an answer as best? Else please let us know if you need more help.
We'd love to hear from you.
Thanks!
- Mark as New
- Bookmark
- Subscribe
- Mute
- Subscribe to RSS Feed
- Permalink
- Report Inappropriate Content
09-07-2022 07:48 AM
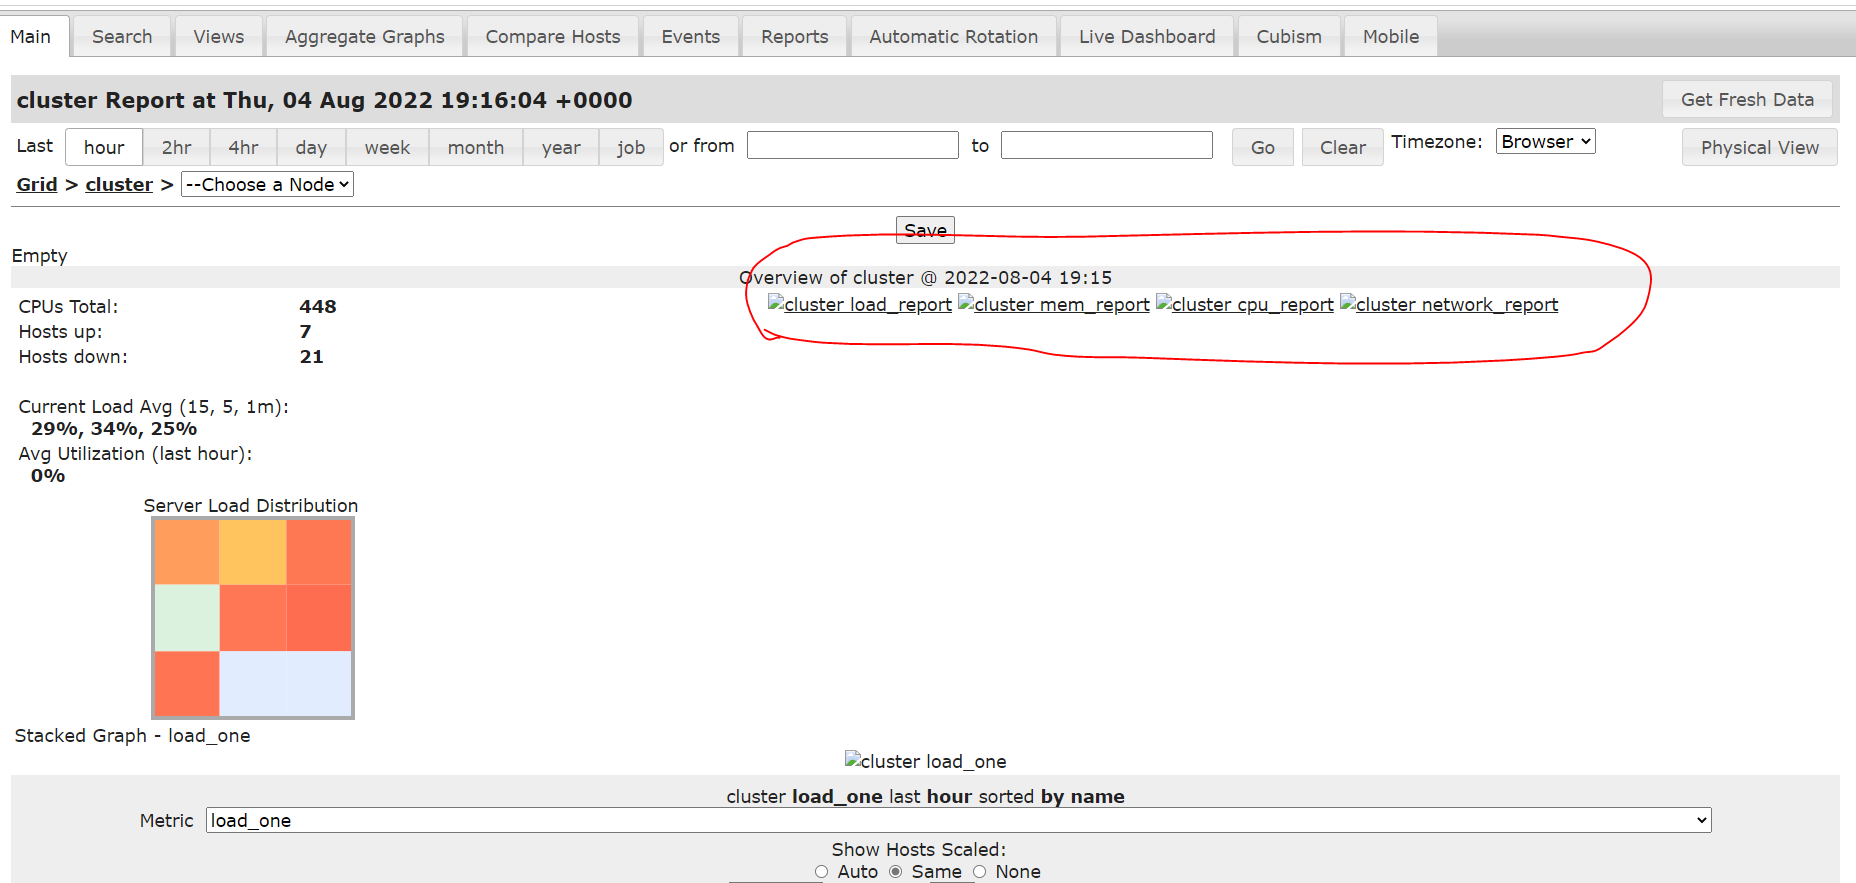
I dont exactly know what was the issue. But, it seems to be related to some kind of network security. Apparently, my IT team had set up a separate vm and making the changes for that specific vm to be able to use Ganglia from there. I end up RDP into the vm, access Ganglia from it. The charts show up fine from it.
But, I agree with Prabhakar - No additional software was needed. It is something to do with the local network preventing loading the charts.

