Turn on suggestions
Auto-suggest helps you quickly narrow down your search results by suggesting possible matches as you type.
Showing results for
Data Engineering
Join discussions on data engineering best practices, architectures, and optimization strategies within the Databricks Community. Exchange insights and solutions with fellow data engineers.
Turn on suggestions
Auto-suggest helps you quickly narrow down your search results by suggesting possible matches as you type.
Showing results for
- Databricks Community
- Data Engineering
- New Visualization Tools
Options
- Subscribe to RSS Feed
- Mark Topic as New
- Mark Topic as Read
- Float this Topic for Current User
- Bookmark
- Subscribe
- Mute
- Printer Friendly Page
New Visualization Tools
Options
- Mark as New
- Bookmark
- Subscribe
- Mute
- Subscribe to RSS Feed
- Permalink
- Report Inappropriate Content
10-06-2022 12:56 PM


5 REPLIES 5
Options
- Mark as New
- Bookmark
- Subscribe
- Mute
- Subscribe to RSS Feed
- Permalink
- Report Inappropriate Content
10-07-2022 10:11 PM
Hi @Suky Muliadikara , Could you please select the table and see if "+" appears there or not?
Ref: https://docs.databricks.com/notebooks/visualizations/index.html
Options
- Mark as New
- Bookmark
- Subscribe
- Mute
- Subscribe to RSS Feed
- Permalink
- Report Inappropriate Content
10-10-2022 07:33 AM
Hi @Kaniz Fatma, I have tried what @Debayan Mukherjee recommended but it still doesn't show the plus sign. Please help 😞 Thank you!
Options
- Mark as New
- Bookmark
- Subscribe
- Mute
- Subscribe to RSS Feed
- Permalink
- Report Inappropriate Content
10-10-2022 09:21 AM

Options
- Mark as New
- Bookmark
- Subscribe
- Mute
- Subscribe to RSS Feed
- Permalink
- Report Inappropriate Content
10-14-2022 05:43 AM
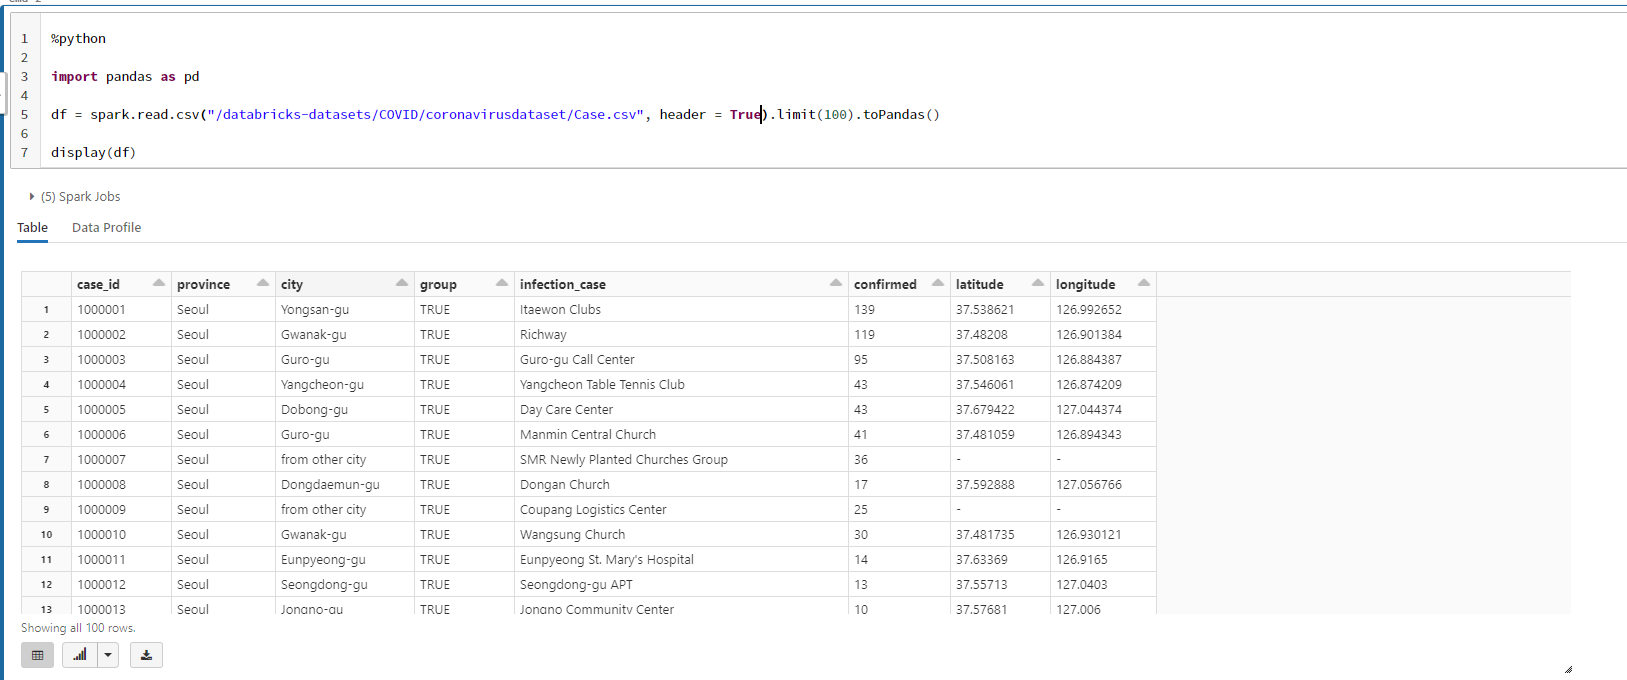
Is it a community version? I see that there is still a chart button below the table.
My blog: https://databrickster.medium.com/
Anonymous
Not applicable
Options
- Mark as New
- Bookmark
- Subscribe
- Mute
- Subscribe to RSS Feed
- Permalink
- Report Inappropriate Content
11-16-2022 07:09 PM
Hi @Suky Muliadikara
Hope all is well! Just wanted to check in if you were able to resolve your issue and would you be happy to share the solution or mark an answer as best? Else please let us know if you need more help.
We'd love to hear from you.
Thanks!
Announcements


Related Content
- V.E.N.K.A.T Framework™ in Data Engineering
- Billing structure and LLM usage costs for no-code agents in Generative AI
- Omnigent: The Control Layer Enterprise AI Needs in Generative AI
- Use of Genie agents for ETL migration in Data Engineering
- Auto-Termination Did Not Trigger on Production Cluster Despite 20-Minute Inactivity in Data Engineering