Turn on suggestions
Auto-suggest helps you quickly narrow down your search results by suggesting possible matches as you type.
Showing results for
Data Engineering
Join discussions on data engineering best practices, architectures, and optimization strategies within the Databricks Community. Exchange insights and solutions with fellow data engineers.
Turn on suggestions
Auto-suggest helps you quickly narrow down your search results by suggesting possible matches as you type.
Showing results for
- Databricks Community
- Data Engineering
- Resource Throttling; Large Merge Operation - Recen...
Options
- Subscribe to RSS Feed
- Mark Topic as New
- Mark Topic as Read
- Float this Topic for Current User
- Bookmark
- Subscribe
- Mute
- Printer Friendly Page
Options
- Mark as New
- Bookmark
- Subscribe
- Mute
- Subscribe to RSS Feed
- Permalink
- Report Inappropriate Content
07-01-2025 05:46 AM - edited 07-01-2025 06:11 AM
Morning all, hope you can help as I've been stumped for weeks.
Question: have there been recent changes to the Databricks query engine, or Photon (etc) which may impact large sort operations?
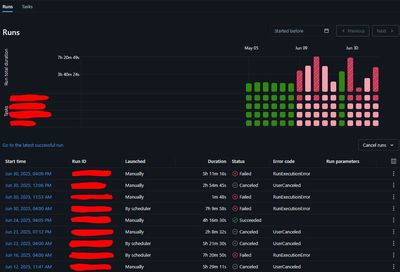
I have a Jobs pipeline that runs a series of notebooks which compile data from a few different operating systems and merge it together. Each notebook has around 100 cells in, pure SQL right now with no Python. This pipeline has been running like clockwork with approx 1hr 45min run time, once weekly, for about a year with zero issues or failures... and then suddenly on 2nd June "stopped working".
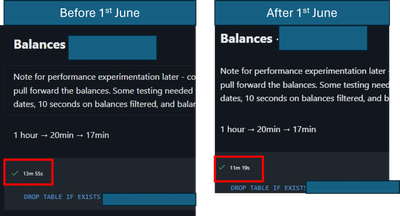
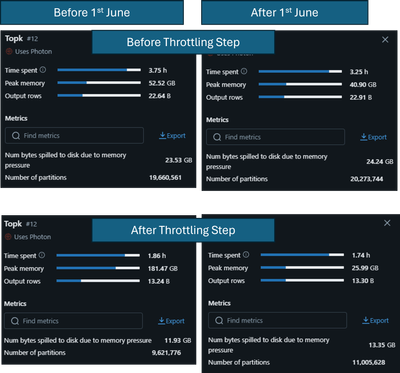
Before you ask: there's no changes in the data volume, no data quality issues, no known changes in our compute settings, etc etc. From looking at the logs, it gets about 2/3rds of the way through the first notebook and, based on some back of the envelope maths around the 1 hour mark seems to suddenly and aggressively throttle the resources. We see that where below we've got the largest single transform in the job running perfectly fine with before and after times:
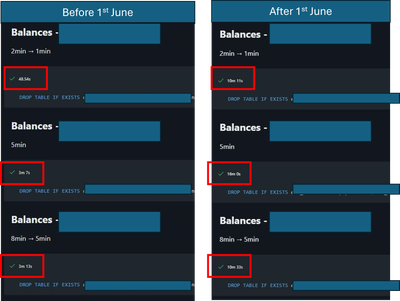
And then a few cells later, hit the hour mark, and resources appear to be rapidly throttled (with a 48 second operation exploding to 10 minutes) until eventually it stops working a few steps after this.
There are some chunky merge operations buried in the middle which involve cross referencing a 400m+ row with a 25m+ row table to create a cartesian monster of order of 12bn rows, before then netting the product down to just keep the most recent records. This is unfortunately due to the way the underlying operating system creates and handles its data, and is basically unavoidable (for purpose of this thread). So in practice this means my memory load rapidly expands for a brief moment to then shrink back down again.
A key point to note is that the cell that works fine before the 1 hour mark is identical code to the later steps that have started to rapidly slow down. They are all scanning the same large table to summarize individual balance types, writing to their own individual tables (1 in, many out). The cell that works fine is by far the largest transform in the workbook.
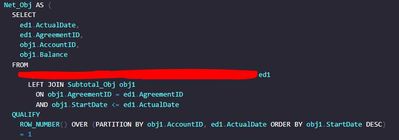
Worked example below just to help visualise what's going on here, as I appreciate the solution may be specific to how QUALIFY works over rn = PARTITION BY (...) followed by a rn=1 in the next step, or something else. I've experimented with pre-sorting Subtotal_Obj or the underlying join table and/or saving to staging tables to reduce the sort load from the QUALIFY PARTITION statement, but my guess here from a query execution plan perspective is even if I know for sure the join is absolutely ordered correctly out the box, the query engine is going to want to check it's in the right order before it applies the partition logic anyway. I know the below looks quirky, but the net result is 1:many on agreements:accounts and the need to reduce it down to 1:1 in the next step with a SUM over agreementID.
I've experimented with simplifying the code (e.g. I'm testing on running batches of AgreementIDs and just iterating through the data), but unfortunately due to the way this transform is a bit unavoidable. I'm also to be honest reticent to mess around with a working and reconciled (at great length!) dataset which had been working fine until a few weeks ago when the compute fairies came along to change it.
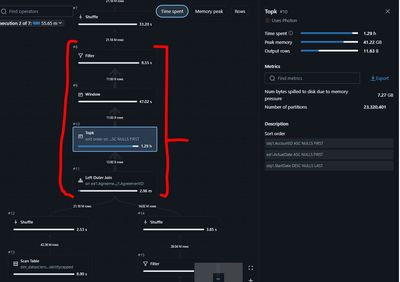
If we look at the peak memory loads, before vs after there's a massive change
Lastly...... it's worth noting that the query execution steps have changed from 4 to 6 for, again, the exact same query. This is a code base that hasn't changed for at least 6 months. Hence my theory it may be an engine change in the back end somewhere.

I did notice that the "Performance Optimisation" box appeared, defaulted on. I turned this off, and didn't get much luck. This is what makes me suspect there may be back end Databricks changes RE: Photon or query execution for which I've been impacted. The only run of this query I've managed to get working is from pure luck, as no settings or code had changed in between - this is key as it's not a code base issue and no data has changed, just a very very small incremental on previous weeks. There's no other particular loads running on our compute at the same time. No compute settings have been changed.
All suggestions welcome 😁
Tom
1 ACCEPTED SOLUTION
Accepted Solutions
Options
- Mark as New
- Bookmark
- Subscribe
- Mute
- Subscribe to RSS Feed
- Permalink
- Report Inappropriate Content
11-08-2025 05:03 AM
There have indeed been recent changes to the Databricks query engine and Photon, especially during the June 2025 platform releases, which may influence how large sort operations and resource allocation are handled in SQL pipelines similar to yours. Specifically, Databricks rolled out several engine upgrades globally in June 2025 that included:
-
Enhanced Predictive Query Execution (PQE), dynamically adjusting query execution in real time to avoid skew, spills, and unnecessary work. This means the execution plan, partitioning, and sorting might be altered automatically and more frequently by the platform.
-
Photon vectorized shuffle, which maintains data in compact columnar format and processes multiple values simultaneously using vectorized instructions. This is intended to boost throughput for CPU-bound workloads such as very large joins and wide aggregations, but may also affect resource demands and execution steps, possibly resulting in changes to observed memory spikes or throttling if jobs hit new thresholds or bottlenecks.
-
General improvements to mixed workload latency and more granular query insights, likely leading to observable changes in execution plans (such as step-count increases for identical code), as the engine applies new optimizations for sort and join-heavy operations.
The introduction of PQE and Photon vectorized shuffle may be causing the resource throttling and change in execution behavior after the one-hour mark, especially for operations involving massive intermediate sort and join steps as described in your pipeline. This is further evidenced by reports and community discussions around similar issues since the June 2025 update—workflows that ran consistently for months are now experiencing unexpected slowdowns and resource caps during larger transforms.
Your observed increase in execution steps (from 4 to 6 for the same query) strongly suggests changes in engine internals, possibly as it breaks down complex transforms to optimize for new vectorized or predictive resource management. While turning off the "Performance Optimisation" box did not help, it's likely because these back-end changes are now enforced globally on supported clusters.
In summary, the root cause is probably the recent Databricks platform upgrade, introducing enhanced query execution plans and Photon shuffle optimizations in June 2025, thus affecting how your large sort and join operations are scheduled and resourced—even without changes in your code or data.
2 REPLIES 2
Options
- Mark as New
- Bookmark
- Subscribe
- Mute
- Subscribe to RSS Feed
- Permalink
- Report Inappropriate Content
11-08-2025 05:03 AM
There have indeed been recent changes to the Databricks query engine and Photon, especially during the June 2025 platform releases, which may influence how large sort operations and resource allocation are handled in SQL pipelines similar to yours. Specifically, Databricks rolled out several engine upgrades globally in June 2025 that included:
-
Enhanced Predictive Query Execution (PQE), dynamically adjusting query execution in real time to avoid skew, spills, and unnecessary work. This means the execution plan, partitioning, and sorting might be altered automatically and more frequently by the platform.
-
Photon vectorized shuffle, which maintains data in compact columnar format and processes multiple values simultaneously using vectorized instructions. This is intended to boost throughput for CPU-bound workloads such as very large joins and wide aggregations, but may also affect resource demands and execution steps, possibly resulting in changes to observed memory spikes or throttling if jobs hit new thresholds or bottlenecks.
-
General improvements to mixed workload latency and more granular query insights, likely leading to observable changes in execution plans (such as step-count increases for identical code), as the engine applies new optimizations for sort and join-heavy operations.
The introduction of PQE and Photon vectorized shuffle may be causing the resource throttling and change in execution behavior after the one-hour mark, especially for operations involving massive intermediate sort and join steps as described in your pipeline. This is further evidenced by reports and community discussions around similar issues since the June 2025 update—workflows that ran consistently for months are now experiencing unexpected slowdowns and resource caps during larger transforms.
Your observed increase in execution steps (from 4 to 6 for the same query) strongly suggests changes in engine internals, possibly as it breaks down complex transforms to optimize for new vectorized or predictive resource management. While turning off the "Performance Optimisation" box did not help, it's likely because these back-end changes are now enforced globally on supported clusters.
In summary, the root cause is probably the recent Databricks platform upgrade, introducing enhanced query execution plans and Photon shuffle optimizations in June 2025, thus affecting how your large sort and join operations are scheduled and resourced—even without changes in your code or data.
Options
- Mark as New
- Bookmark
- Subscribe
- Mute
- Subscribe to RSS Feed
- Permalink
- Report Inappropriate Content
11-10-2025 02:20 AM
Mark - this is really helpful thank you. We found a workaround in the end by tweaking the operation to reduce its memory load in a manner which didn't alter the output, but this feedback is really helpful as we'll be looking to rework some of these pipelines in the next few months.
KR
T
Announcements
Related Content
- Are there limits set for Agent Mode in Databricks Free Edition? in Generative AI
- Disable Public Network Access on Databricks Managed Storage Account - Deny Assignment in Data Engineering
- Materialized view creation fails in Data Engineering
- Can't Migrate Auto Loader To File Events in Data Engineering
- Unavailable GPU compute in Data Engineering
