cancel
Showing results for 
Search instead for 
Did you mean: 
Get Started Discussions
Start your journey with Databricks by joining discussions on getting started guides, tutorials, and introductory topics. Connect with beginners and experts alike to kickstart your Databricks experience.
cancel
Showing results for 
Search instead for 
Did you mean: 

New Cluster 90% memory already consumed

AbhishekNegi
New Contributor

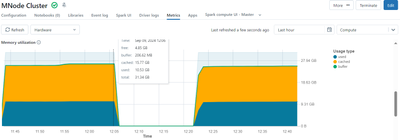
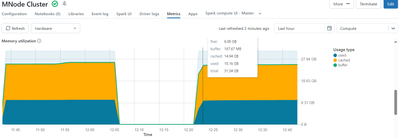
Hi, seeing this on all new clusters (single or multi-node) I am creating. As soon as the metrics start showing up, the memory consumption shows 90% already consumed between Used and Cached (something like below). This is the case with higher or lower memory clusters, the % consumed increases with total memory. The cluster is brand new and has not been used and no library has been installed yet. Restarting does not change much either.
AbhishekNegi_0-1725911074420.png

AbhishekNegi_1-1725911119189.png

The problem is, when I did attach a notebook to one of the new clusters, after the first run the cells would just hang on execution and Metrics would show 99%+ consumed. The cluster would effectively become useless.

I have tried all of the suggestions I could find such as, spark.catalog.clearCache, sqlContext.clearCache, spark.sql("CLEAR CACHE"), NukeAllCaching method etc, without any benefit.

Please advice what am I missing to setup the cluster correctly.

1 REPLY 1

saikumar246
Databricks Employee
Databricks Employee

Hi @AbhishekNegi I understand your concern.

The reason for you to see memory consumption before initiating any task and regarding the comment taking time to execute. This is how Spark internally works.

The memory consumption observed in a Spark cluster immediately after startup, even before any tasks are executed, can be attributed to several factors inherent to the Spark framework and the JVM (Java Virtual Machine) on which it runs. 

Spark Framework Overhead

  • Spark Driver and Executors: Upon startup, Spark initializes the driver and executors. These components are responsible for the execution of tasks and management of data across the cluster. The driver and each executor consume memory for their operation, including thread management, and internal data structures.
  • Default Caching and Persistence: Spark's storage memory is used for caching and persistence of data. Even if you haven't explicitly cached any data yet, Spark reserves a portion of memory for this purpose. The spark.memory.storageFraction parameter controls the size of this memory pool. (In your case it’s 0.5)

JVM Overhead

  • JVM Heap Space: The JVM allocates heap space for objects and other data structures used by the application. A portion of this heap space is consumed by Spark and its dependencies upon initialization.
  • Garbage Collection (GC) and Metadata: The JVM uses memory for garbage collection overhead and to store metadata about the objects in the heap. This includes class metadata, JIT (Just-In-Time) compilation optimizations, and other runtime data structures.
  • JVM Native Memory: Apart from the heap, the JVM also uses native memory for its operation, which includes the Java stack, code cache, and direct buffers. This memory usage is not part of the JVM heap but still contributes to the overall memory footprint of the Spark application.


The comment for a cluster taking time is likely due to the initialization and setup of the Spark environment, which includes the following factors:

  1. Spark Driver and Executor Startup: When you create a cluster, Spark initializes the driver and executors. This process involves setting up the Spark environment, loading dependencies, and allocating resources.
  2. JVM Warm-up: The Java Virtual Machine (JVM) needs time to warm up and initialize its internal components, such as the garbage collector, class loaders, and JIT (Just-In-Time) compiler.
  3. Spark Context Creation: Spark creates a SparkContext, which is the entry point to any Spark functionality. This involves setting up the Spark configuration, creating the Spark UI, and initializing the Spark listener bus.
  4. Dependency Loading: Spark loads its dependencies, including libraries and jars, which can take some time depending on the size of the dependencies and the network connection.
  5. Security and Authentication: Spark performs security checks and authenticates with the underlying storage systems, such as AWS S3 or Azure Blob Storage, which can add to the startup time.
  6. Cluster Manager Initialization: The cluster manager, such as YARN or Mesos, initializes and sets up the Spark application, which includes allocating resources, scheduling tasks, and monitoring the application.

These factors contribute to the initial delay when running the first command in a cluster. Subsequent commands typically execute faster since the Spark environment is already set up and initialized.

Leave a like if this helps, followups are appreciated.

Kudos,

Sai Kumar

Connect with Databricks Users in Your Area

Join a Regional User Group to connect with local Databricks users. Events will be happening in your city, and you won’t want to miss the chance to attend and share knowledge.

If there isn’t a group near you, start one and help create a community that brings people together.

Request a New Group