Turn on suggestions
Auto-suggest helps you quickly narrow down your search results by suggesting possible matches as you type.
Showing results for
Administration & Architecture
Explore discussions on Databricks administration, deployment strategies, and architectural best practices. Connect with administrators and architects to optimize your Databricks environment for performance, scalability, and security.
Turn on suggestions
Auto-suggest helps you quickly narrow down your search results by suggesting possible matches as you type.
Showing results for
- Databricks Community
- Administration & Architecture
- Small files and discrepancy in S3 vs catalog
Options
- Subscribe to RSS Feed
- Mark Topic as New
- Mark Topic as Read
- Float this Topic for Current User
- Bookmark
- Subscribe
- Mute
- Printer Friendly Page
Options
- Mark as New
- Bookmark
- Subscribe
- Mute
- Subscribe to RSS Feed
- Permalink
- Report Inappropriate Content
10-17-2023 02:26 PM
Hello all,
I'm in the process of optimizing my tables and I'm running into a confusing situation. I have a table named "trace_messages_fg_streaming_event". If I navigate to the Databricks catalog, it shows stats:
Size: 6.7GB, Files: 464
But when I look at our actual S3 location
File Count: 2544762
Total Size (in bytes): 789695631757 (735.69 gigabytes)
The file count above is gathered using a script parsing an aws s3 ls command line for the root folder of my delta table. This is not a recursive call so it's only counting root files, not files under the delta log folder, etc. We chose not to partition this table as given the size of our data it seemed that Zordering the whole table nightly was a better solution for consolidated files (and thus performance).
Table config:
delta.autoOptimize.autoCompact=false
delta.autoOptimize.optimizeWrite=true
delta.minReaderVersion=1
delta.minWriterVersion=6
delta.targetFileSize=1073741824
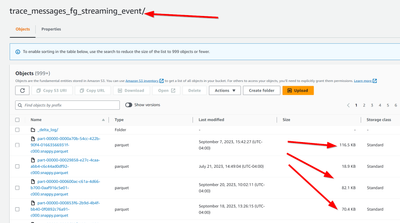
This table is being constantly written to by a write stream, so I understand that there may be smaller files as part of the write, but those should be cleaned up with the nightly optimize. These small files we're seeing are spread out over the past year. Example screen shot:
Zordering is based on day for these logs - we've tried several approaches including optimize without zordering and we still have many many small files. Also the Zorder doesn't really take that long either (a couple minutes) which is suspicious to me.
Any insight/help on what we're seeing would be greatly appreciated!
Thanks, Brad
1 ACCEPTED SOLUTION
Accepted Solutions
Options
- Mark as New
- Bookmark
- Subscribe
- Mute
- Subscribe to RSS Feed
- Permalink
- Report Inappropriate Content
10-26-2023 06:22 AM
Nevermind, I'm dumb, figured it out, high frequency transactions leave many little files that need to be vacuumed.
3 REPLIES 3
Options
- Mark as New
- Bookmark
- Subscribe
- Mute
- Subscribe to RSS Feed
- Permalink
- Report Inappropriate Content
10-20-2023 04:40 PM
Hi Kaniz - I checked and it's a bit confusing, as far as I know delta version is attached to cluster runtime and we've been upgrading that over time - we've been at 12.2 for a while but now we're up to 13.3 LTS. The really strange thing is today I decided to clone the table, and the cloned table is literally maybe a dozen files. I'm still not sure what all those residual files are but perhaps they are left over from something that happened in the past - anyways I think we're going to re-clone over the weekend and switch our pipeline to the new table and see how it goes.
Options
- Mark as New
- Bookmark
- Subscribe
- Mute
- Subscribe to RSS Feed
- Permalink
- Report Inappropriate Content
10-25-2023 05:05 AM
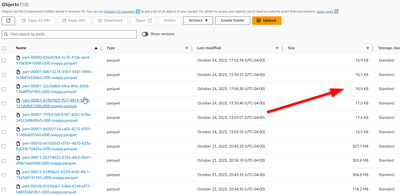
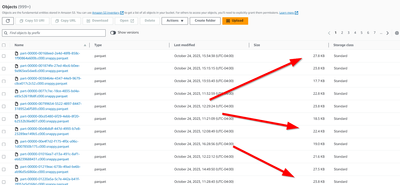
Hi all - quick update, I've rebuilt the table, and am using partitioning now by year and quarter (just a side note really), and after the initial rebuild (using structured streaming loading millions of small json files), the file sizes looked great. But I'm still having problems, and it comes down to the structured streaming writes I have.
2023/Q2 (no file writes as it's too far back, looks great):
2023/Q3 (A few writes since we're near the boundary, you see the small files):
2023/Q4 (majority of writes here, tons of small files):
So then I run an optimize on 2023/Q4 partition and get:
{
"numFilesAdded": 0,
"numFilesRemoved": 0,
"filesAdded": {
"min": null,
"max": null,
"avg": 0,
"totalFiles": 0,
"totalSize": 0
},
"filesRemoved": {
"min": null,
"max": null,
"avg": 0,
"totalFiles": 0,
"totalSize": 0
},
"partitionsOptimized": 1,
"zOrderStats": null,
"numBatches": 0,
"totalConsideredFiles": 2,
"totalFilesSkipped": 2,
"preserveInsertionOrder": true,
"numFilesSkippedToReduceWriteAmplification": 0,
"numBytesSkippedToReduceWriteAmplification": 0,
"startTimeMs": 1698234957310,
"endTimeMs": 1698234959099,
"totalClusterParallelism": 12,
"totalScheduledTasks": 0,
"autoCompactParallelismStats": null,
"deletionVectorStats": {
"numDeletionVectorsRemoved": 0,
"numDeletionVectorRowsRemoved": 0
},
"numTableColumns": 60,
"numTableColumnsWithStats": 32,
"totalTaskExecutionTimeMs": 0,
"skippedArchivedFiles": 0,
"clusteringMetrics": null
}
The files we are reading are json files that correlate to one row in the table and we're processing about 150k files/rows a day into this table, using a standard readstream + writestream in pyspark. This is a delta table, and also has autocompact=true and optimizewrites=true.
I'm at a loss why these files are not getting consolidated, and would love a solution that would keep them optimized in file sizes around 250-300MB. Over time this will become a big performance problem, and I'd rather not have to rebuild my entire table periodically. I'm hoping I'm just missing something key here. Also using clusters with the latest (as of today) 13.3 LTS runtime.
Any insight/help into diagnosing this issue would be greatly appreciated!
Regards,
Brad
Options
- Mark as New
- Bookmark
- Subscribe
- Mute
- Subscribe to RSS Feed
- Permalink
- Report Inappropriate Content
10-26-2023 06:22 AM
Nevermind, I'm dumb, figured it out, high frequency transactions leave many little files that need to be vacuumed.
Announcements
Related Content
- Environment-Specific Schemas in SQL Files in Data Engineering
- Is there a Sample Java Program using Databricks Connect Library to query a table In the Free Editio? in Warehousing & Analytics
- Terraform folder structure and states in Administration & Architecture
- Declarative Automation Bundles Volume creation fails with CATALOG_DOES_NOT_EXIST on first deploy in Data Engineering
- Iceberg native table Streaming in databricks in Data Engineering


