Turn on suggestions
Auto-suggest helps you quickly narrow down your search results by suggesting possible matches as you type.
Showing results for
Data Engineering
Join discussions on data engineering best practices, architectures, and optimization strategies within the Databricks Community. Exchange insights and solutions with fellow data engineers.
Turn on suggestions
Auto-suggest helps you quickly narrow down your search results by suggesting possible matches as you type.
Showing results for
- Databricks Community
- Data Engineering
- How can I view the query history, duration, etc fo...
Options
- Subscribe to RSS Feed
- Mark Topic as New
- Mark Topic as Read
- Float this Topic for Current User
- Bookmark
- Subscribe
- Mute
- Printer Friendly Page
Options
- Mark as New
- Bookmark
- Subscribe
- Mute
- Subscribe to RSS Feed
- Permalink
- Report Inappropriate Content
02-12-2022 01:39 PM
Hi! I have some jobs that stay idle for some time when getting data from a S3 mount on DBFS, this are all SQL queries on Delta, how can I know where is the bottle neck, duration, cue? to diagnose the slow spark performance that I think is on the process of getting the data.
And also to send recomendations to users publishing jobs with SQL bad practices.
Thanks!
Labels:
- Labels:
-
Query History


1 ACCEPTED SOLUTION
Accepted Solutions
Options
- Mark as New
- Bookmark
- Subscribe
- Mute
- Subscribe to RSS Feed
- Permalink
- Report Inappropriate Content
03-16-2022 07:16 AM
We found out we were regeneratig the symlink manifest for all the partitions on this case. And for some reason it was executed twice, at start and end of the job.
delta_table.generate('symlink_format_manifest')
We configured the table with:
ALTER TABLE delta.`<path-to-delta-table>` SET TBLPROPERTIES(delta.compatibility.symlinkFormatManifest.enabled=true)
and removed the symlink creation on the job and all worked great from 2hs to 30 min.
Thanks!
11 REPLIES 11
Options
- Mark as New
- Bookmark
- Subscribe
- Mute
- Subscribe to RSS Feed
- Permalink
- Report Inappropriate Content
02-13-2022 02:20 PM
Could you please give an example of your issue? As it's not clear where exactly are you facing issue.
Is the issue with loading files to S3 and processing them or you've bunch of queries that take longer than usual?
To view query history on databricks, go to query history tab in your workspace.
Options
- Mark as New
- Bookmark
- Subscribe
- Mute
- Subscribe to RSS Feed
- Permalink
- Report Inappropriate Content
02-13-2022 02:57 PM
The issue appears to be when I query the Delta Lake from a Databricks spark job, I say appears to be because in not so complex processes when the first step is an SQL query the cluster stays idle for 10+ minutes (no data in or out, almost no CPU, no ram changes).
The S3/AWS reference was to tell you on which cloud service we are working.
When I go into the Query History tab don't see anything related to other users, maybe I'm the only one executing queries via Databricks at this point, but the Spark job is making the queries, so I think there should be a log of those, Am I wrong?
Thanks!
Options
- Mark as New
- Bookmark
- Subscribe
- Mute
- Subscribe to RSS Feed
- Permalink
- Report Inappropriate Content
02-13-2022 03:01 PM
Could you share a screenshot?
When you say you're querying delta lake from Databricks spark job, do you mean to say that you're using Databricks Jobs to run a notebook with an SQL in it?
Options
- Mark as New
- Bookmark
- Subscribe
- Mute
- Subscribe to RSS Feed
- Permalink
- Report Inappropriate Content
02-13-2022 03:15 PM
I have a spark job on PySpark it runs a query like this but much complex:
data = spark.sql( "SELECT * FROM schema.table INNER JOIN...WHERE...etc etc ec")
agains the Delta Lake, do some heavy process on the result, and the store it on another table.
I named a lot of things :P, a screenshot of what process will be useful? Thanks
Options
- Mark as New
- Bookmark
- Subscribe
- Mute
- Subscribe to RSS Feed
- Permalink
- Report Inappropriate Content
02-13-2022 03:20 PM
Probably a screesnhot of any logs or maybe something that shows cluster stays idle for 10+ minutes (no data in or out, almost no CPU, no ram changes) when you submit the query
Options
- Mark as New
- Bookmark
- Subscribe
- Mute
- Subscribe to RSS Feed
- Permalink
- Report Inappropriate Content
02-13-2022 03:33 PM


Options
- Mark as New
- Bookmark
- Subscribe
- Mute
- Subscribe to RSS Feed
- Permalink
- Report Inappropriate Content
02-13-2022 03:53 PM
If you're running the spark job from within the notebook, then you won't see any SQL queries in Query History tab.
The Query History tab shows queries that were executed using SQL Endpoints and not via clusters.
Next, the issue that you're facing could be due to small cluster size. Say, you start a cluster with 2 nodes and give 8 nodes as upper limit. When you run a query, the cluster might undergo resizing to add more nodes for serving multiple JOINS in your query. You can check that from Event log tab of a cluster. If that's the case, then probably start your cluster with 4 nodes at least. Also check the worker type and driver type of cluster that you're using.
Could you please do following:
Run the query for first time. It might take 10 minutes as you say. The moment you get the output, re-run the query immediately and check how much time it takes. Is it less as compared to previous run?
Options
- Mark as New
- Bookmark
- Subscribe
- Mute
- Subscribe to RSS Feed
- Permalink
- Report Inappropriate Content
02-13-2022 04:12 PM
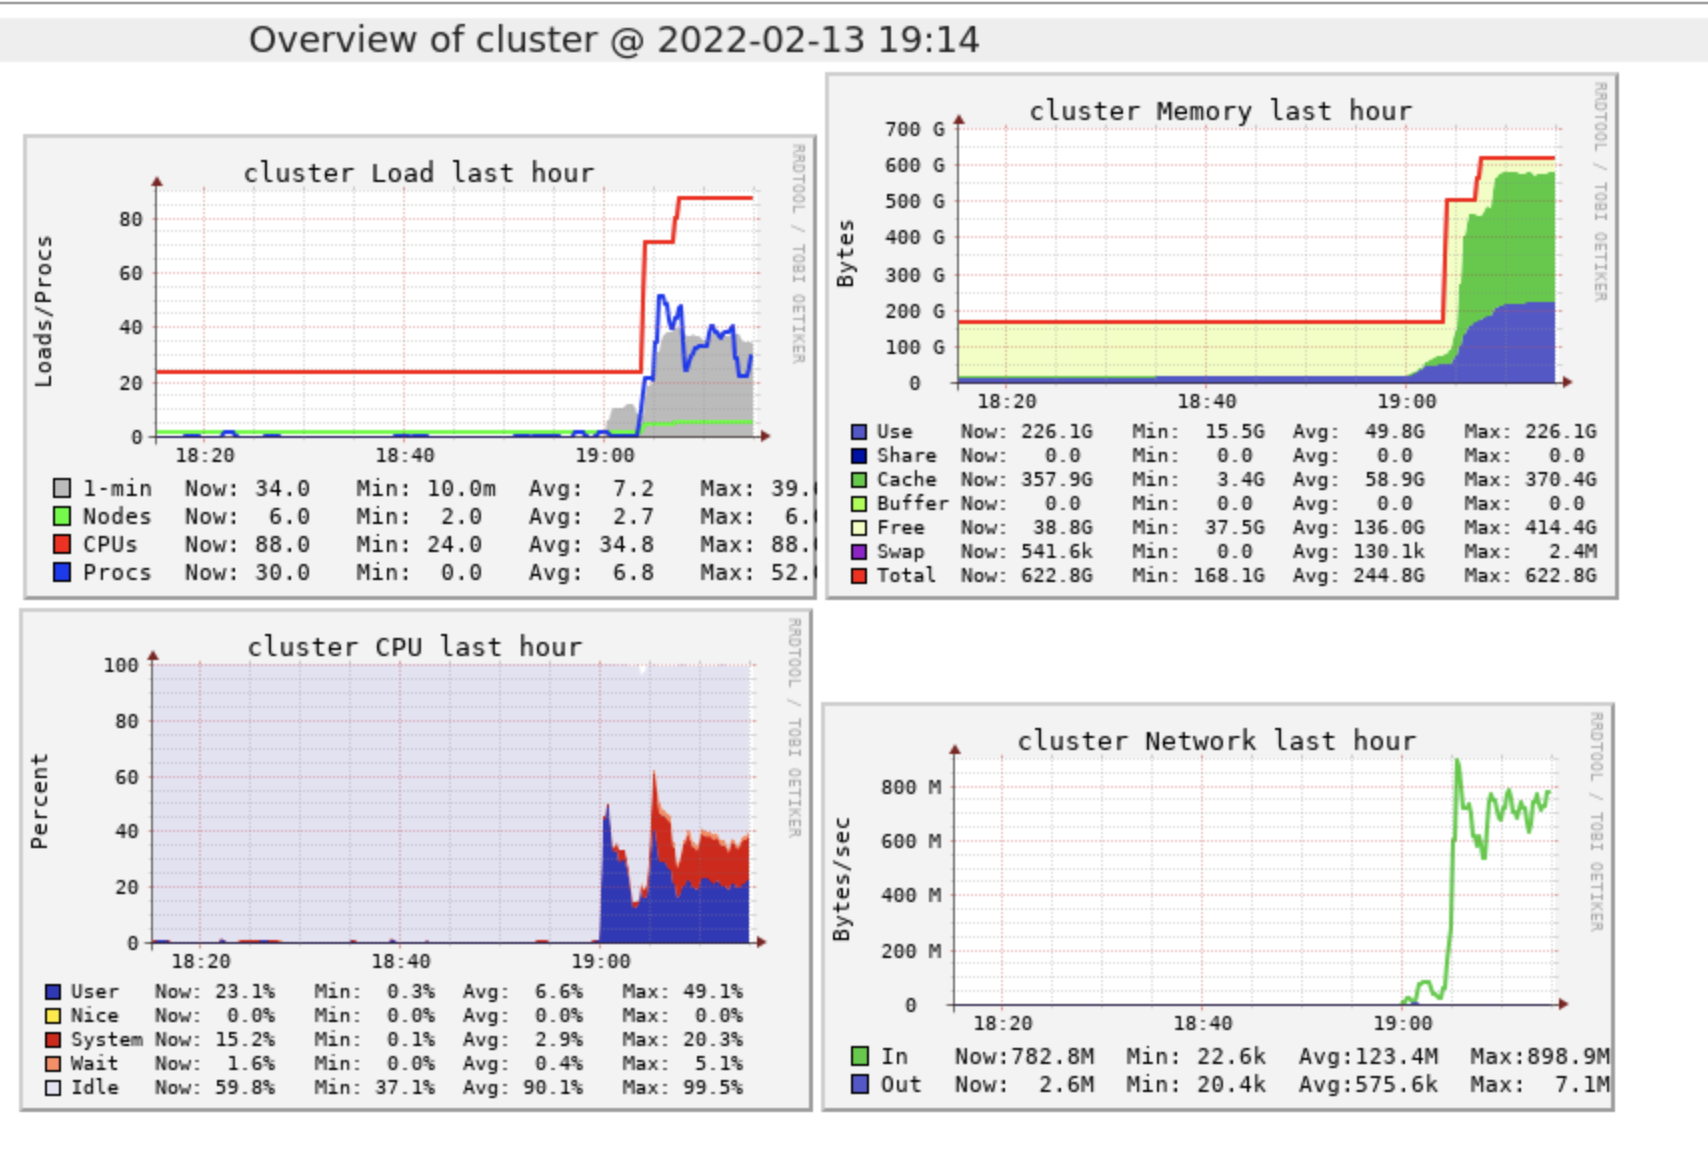
As you can see on the second screenshot after 40 minutes with 2 nodes it start receiving data and then it scales to 8 very fast. I don't think that this is slow scaling problem (either way I just configure the minimum to 4 instead of two to see if there are any changes)
Will try the second part of your answer tomorrow,
thank you!
Options
- Mark as New
- Bookmark
- Subscribe
- Mute
- Subscribe to RSS Feed
- Permalink
- Report Inappropriate Content
03-15-2022 09:55 PM
@Alejandro Martinez was following up. Are you able to get the desired scenario after your test?
Options
- Mark as New
- Bookmark
- Subscribe
- Mute
- Subscribe to RSS Feed
- Permalink
- Report Inappropriate Content
03-16-2022 07:16 AM
We found out we were regeneratig the symlink manifest for all the partitions on this case. And for some reason it was executed twice, at start and end of the job.
delta_table.generate('symlink_format_manifest')
We configured the table with:
ALTER TABLE delta.`<path-to-delta-table>` SET TBLPROPERTIES(delta.compatibility.symlinkFormatManifest.enabled=true)
and removed the symlink creation on the job and all worked great from 2hs to 30 min.
Thanks!
Options
- Mark as New
- Bookmark
- Subscribe
- Mute
- Subscribe to RSS Feed
- Permalink
- Report Inappropriate Content
03-22-2022 02:25 PM
Hi @Alejandro Martinez ,
Thank you for providing the solution to this issue. It would help if you mark it a best response.
Announcements


Related Content
- Genie Code Usage Dashboard in Administration & Architecture
- Incremental monthly UDF analytics on large time-series: full reprocess vs change-driven recompute in Data Engineering
- Delta Sharing - Open, Secure, and Barrier-Free Data & AI Collaboration in Data Governance
- API GENIE in Generative AI
- Best Practice: Data Modeling for Customer 360 with Refined/Gold Source Data in Data Engineering