Turn on suggestions
Auto-suggest helps you quickly narrow down your search results by suggesting possible matches as you type.
Showing results for
Data Engineering
Join discussions on data engineering best practices, architectures, and optimization strategies within the Databricks Community. Exchange insights and solutions with fellow data engineers.
Turn on suggestions
Auto-suggest helps you quickly narrow down your search results by suggesting possible matches as you type.
Showing results for
- Databricks Community
- Data Engineering
- How do I enable new Visualization tools in my Data...
Options
- Subscribe to RSS Feed
- Mark Topic as New
- Mark Topic as Read
- Float this Topic for Current User
- Bookmark
- Subscribe
- Mute
- Printer Friendly Page
How do I enable new Visualization tools in my Databricks notebooks?
Options
- Mark as New
- Bookmark
- Subscribe
- Mute
- Subscribe to RSS Feed
- Permalink
- Report Inappropriate Content
07-21-2022 10:24 AM
Databricks released new visualization tools
https://docs.databricks.com/notebooks/visualizations/index.html
But I don't see them in my notebook (DBR 10.4) nor I can find out how to enable them. How do I use the new tools?

Sergey
Labels:
- Labels:
-
Databricks Notebooks
-
Visualization


7 REPLIES 7
Options
- Mark as New
- Bookmark
- Subscribe
- Mute
- Subscribe to RSS Feed
- Permalink
- Report Inappropriate Content
07-21-2022 10:28 AM
@Sergey Ivanychev
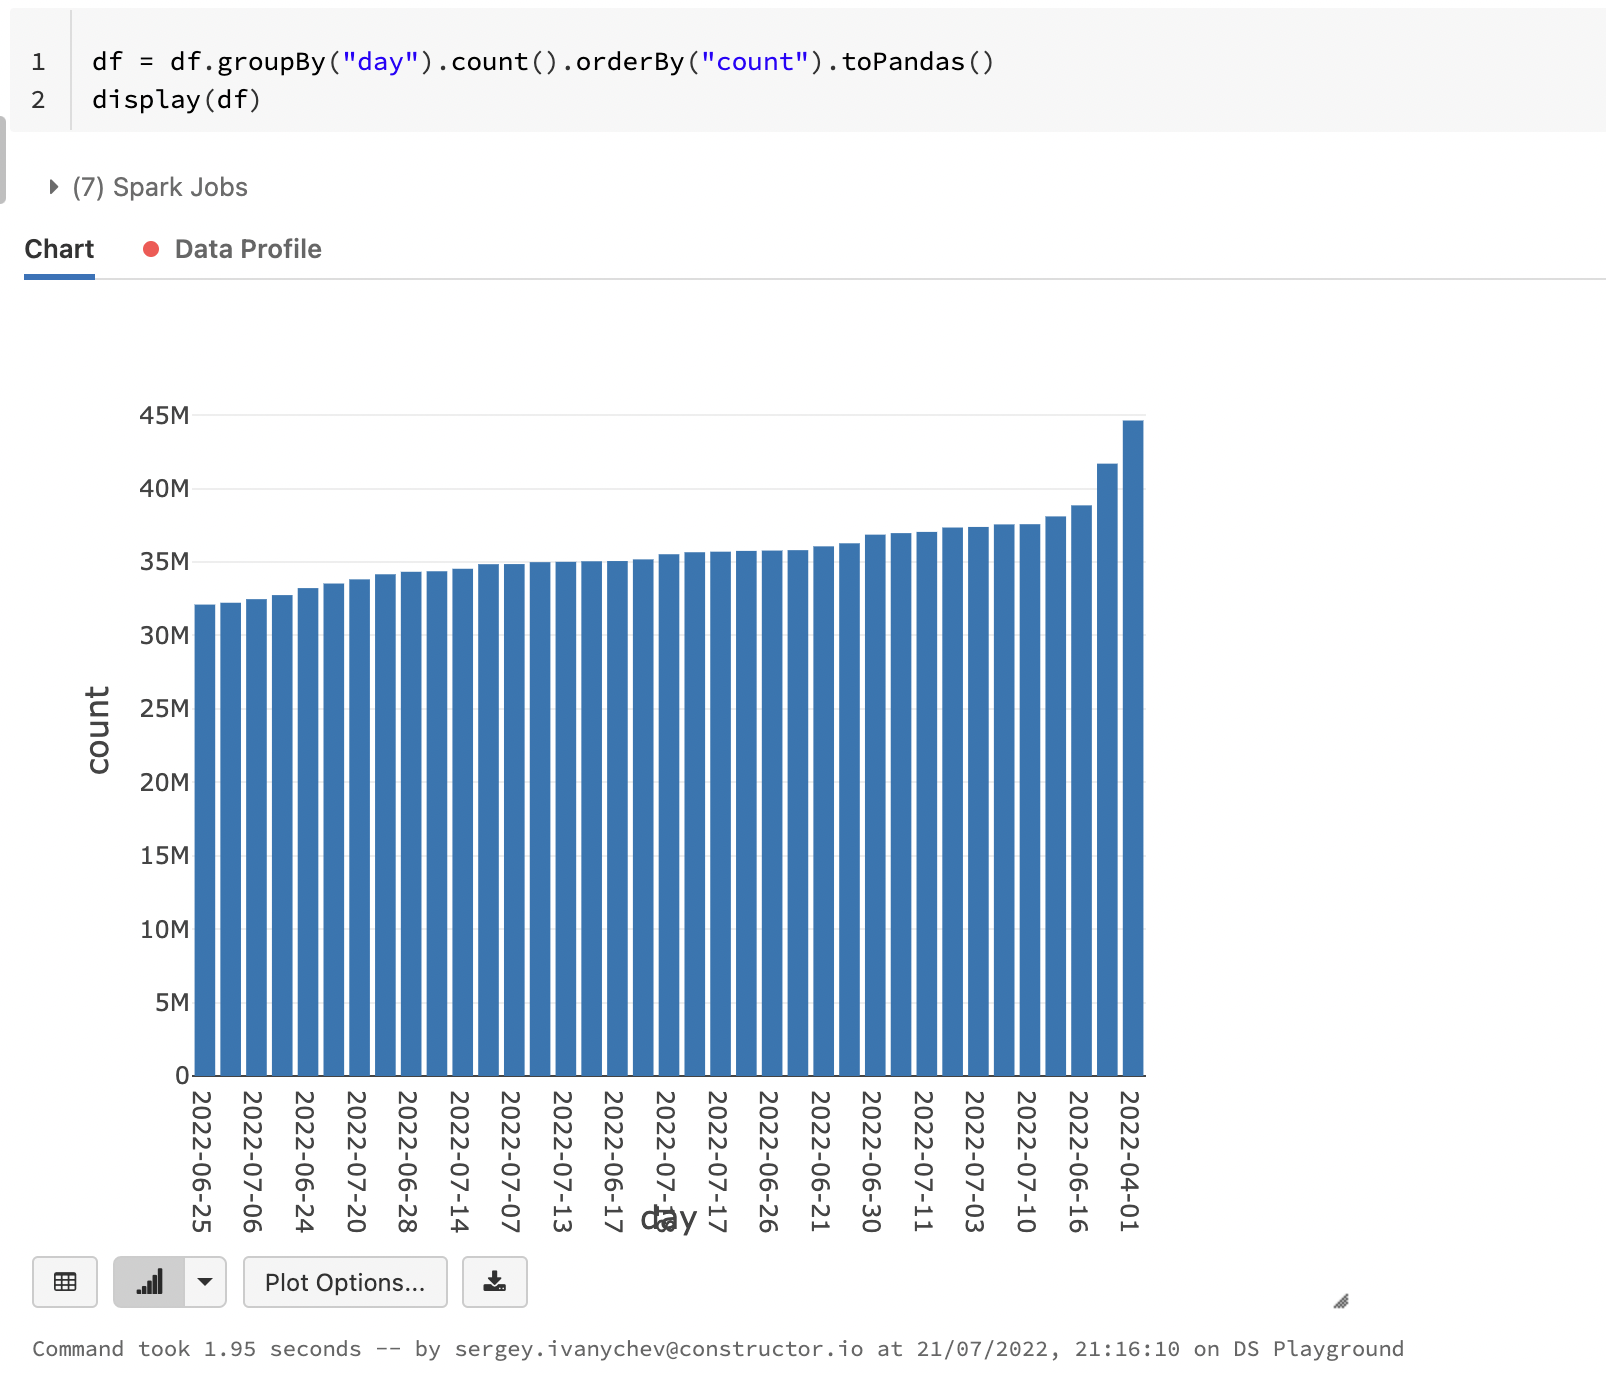
To create a visualization from a cell result, the notebook cell must use a
display
command to show the result. Click + and select . The visualization editor appears.
are you not seeing this visualisation after hitting above?
Options
- Mark as New
- Bookmark
- Subscribe
- Mute
- Subscribe to RSS Feed
- Permalink
- Report Inappropriate Content
07-21-2022 11:00 AM
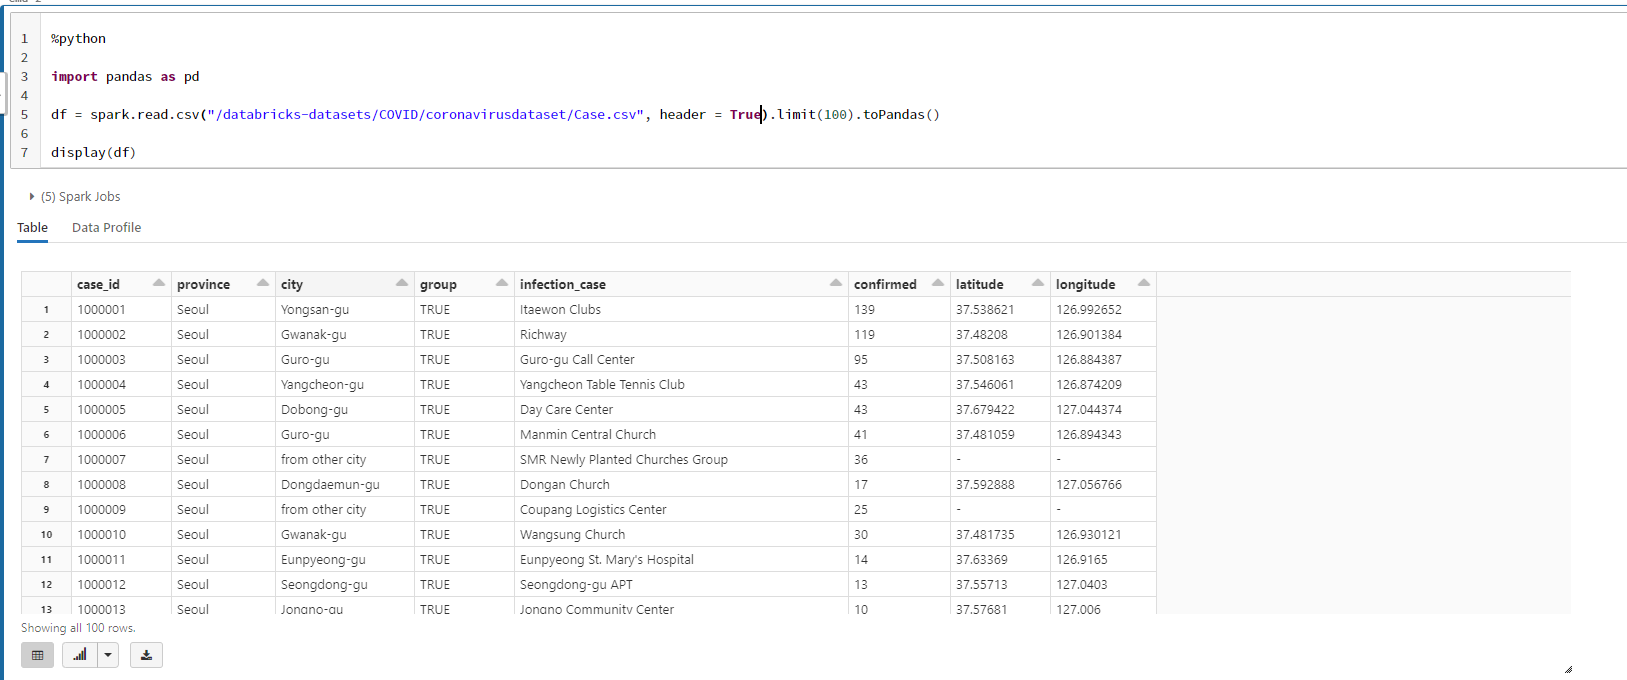
Sorry, I uploaded the wrong screenshot. Now it's the correct one. I don't see the + button 😞
Sergey
Options
- Mark as New
- Bookmark
- Subscribe
- Mute
- Subscribe to RSS Feed
- Permalink
- Report Inappropriate Content
07-21-2022 11:07 AM
Ok. I will suggest please wait for few more days as we do have stage wise release and this may be reflected soon. Sorry for the inconvenience caused @Sergey Ivanychev
Options
- Mark as New
- Bookmark
- Subscribe
- Mute
- Subscribe to RSS Feed
- Permalink
- Report Inappropriate Content
07-21-2022 12:05 PM
Thanks!
Sergey
Options
- Mark as New
- Bookmark
- Subscribe
- Mute
- Subscribe to RSS Feed
- Permalink
- Report Inappropriate Content
08-18-2022 11:46 PM
Hi @Atanu Sarkar!
Any update on this? I'm also not capable of seeing the + button!
Options
- Mark as New
- Bookmark
- Subscribe
- Mute
- Subscribe to RSS Feed
- Permalink
- Report Inappropriate Content
07-23-2022 01:42 AM
Thank you for sharing this. It looks like Databricks has copied over DB SQL visualization to notebooks.
This is good.
@Atanu Sarkar - do you know if we will be able to link these visualizations from notebook cell into DB SQL dashboard some how?
Options
- Mark as New
- Bookmark
- Subscribe
- Mute
- Subscribe to RSS Feed
- Permalink
- Report Inappropriate Content
10-10-2022 09:23 AM

Announcements


Related Content
- Asset Bundles Setup in Warehousing & Analytics
- Can Databricks Jobs Run on Kubernetes Clusters? in Machine Learning
- Legacy Modernization Isn’t a Technology Problem in Data Engineering
- Managing IPYNB cell timestamps in source control in Data Engineering
- Premium account suspended 6+ days over a $0.51 invoice we can't pay — billing unresponsive in Administration & Architecture