Turn on suggestions
Auto-suggest helps you quickly narrow down your search results by suggesting possible matches as you type.
Showing results for
Data Engineering
Join discussions on data engineering best practices, architectures, and optimization strategies within the Databricks Community. Exchange insights and solutions with fellow data engineers.
Turn on suggestions
Auto-suggest helps you quickly narrow down your search results by suggesting possible matches as you type.
Showing results for
- Databricks Community
- Data Engineering
- How to display SHAP plots?
Options
- Subscribe to RSS Feed
- Mark Topic as New
- Mark Topic as Read
- Float this Topic for Current User
- Bookmark
- Subscribe
- Mute
- Printer Friendly Page
Options
- Mark as New
- Bookmark
- Subscribe
- Mute
- Subscribe to RSS Feed
- Permalink
- Report Inappropriate Content
02-13-2019 11:29 AM
I am looking to display SHAP plots, here is the code:
import xgboost import shapshap.initjs() # load JS visualization code to notebookX,y = shap.datasets.boston() # train XGBoost model
model = xgboost.train({"learning_rate": 0.01}, xgboost.DMatrix(X, label=y), 100)
explainer = shap.TreeExplainer(model) # explain the model's predictions using SHAP values
shap_values = explainer.shap_values(X)
shap_explain = shap.force_plot(explainer.expected_value, shap_values[0,:], X.iloc[0,:]) # visualize the first prediction's explanation
displayHTML(shap_explain.data) # display plot
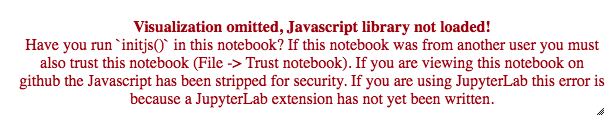
However I am receiving the following error:

Any help greatly appreciated!
Labels:
- Labels:
-
Displayhtml
-
Shap


1 ACCEPTED SOLUTION
Accepted Solutions
Options
- Mark as New
- Bookmark
- Subscribe
- Mute
- Subscribe to RSS Feed
- Permalink
- Report Inappropriate Content
02-17-2019 10:26 PM
I was finally able to plot them in DataBricks without js
shap_display = shap.force_plot(explainer.expected_value[1], shap_value[1], feat_x.iloc[0, :], matplotlib=True)display(shap_display)
5 REPLIES 5
Options
- Mark as New
- Bookmark
- Subscribe
- Mute
- Subscribe to RSS Feed
- Permalink
- Report Inappropriate Content
02-17-2019 10:26 PM
I was finally able to plot them in DataBricks without js
shap_display = shap.force_plot(explainer.expected_value[1], shap_value[1], feat_x.iloc[0, :], matplotlib=True)display(shap_display)
Options
- Mark as New
- Bookmark
- Subscribe
- Mute
- Subscribe to RSS Feed
- Permalink
- Report Inappropriate Content
01-06-2020 10:23 PM
It is quite good but only works for a single explanation. If you want to apply to multiple samples, force_plot has not been supported yet as in Jan 2020.
Options
- Mark as New
- Bookmark
- Subscribe
- Mute
- Subscribe to RSS Feed
- Permalink
- Report Inappropriate Content
02-21-2019 07:27 AM
It also needs to be run on an earlier version of matplotlib
matplotlib: 1.5.3
Options
- Mark as New
- Bookmark
- Subscribe
- Mute
- Subscribe to RSS Feed
- Permalink
- Report Inappropriate Content
06-18-2019 06:21 PM
For what it's worth, I got force plots to work in Databricks by copying the bundle.js Javascript from the SHAP package into a hidden cell in the notebook. See https://databricks.com/blog/2019/06/17/detecting-bias-with-shap.html and the notebook that accompanies it.
Options
- Mark as New
- Bookmark
- Subscribe
- Mute
- Subscribe to RSS Feed
- Permalink
- Report Inappropriate Content
02-05-2020 08:07 AM
As @Vinh dqvinh87 noted, the accepted solution only works for
force_plot. For other plots, the following trick works for me:
import matplotlib.pyplot as plt
p = shap.summary_plot(shap_values, test_df, show=False)
display(p)
Announcements


