Turn on suggestions
Auto-suggest helps you quickly narrow down your search results by suggesting possible matches as you type.
Showing results for
Data Engineering
Join discussions on data engineering best practices, architectures, and optimization strategies within the Databricks Community. Exchange insights and solutions with fellow data engineers.
Turn on suggestions
Auto-suggest helps you quickly narrow down your search results by suggesting possible matches as you type.
Showing results for
- Databricks Community
- Data Engineering
- Python Graph not showing
Options
- Subscribe to RSS Feed
- Mark Topic as New
- Mark Topic as Read
- Float this Topic for Current User
- Bookmark
- Subscribe
- Mute
- Printer Friendly Page
Options
- Mark as New
- Bookmark
- Subscribe
- Mute
- Subscribe to RSS Feed
- Permalink
- Report Inappropriate Content
03-24-2022 05:23 PM
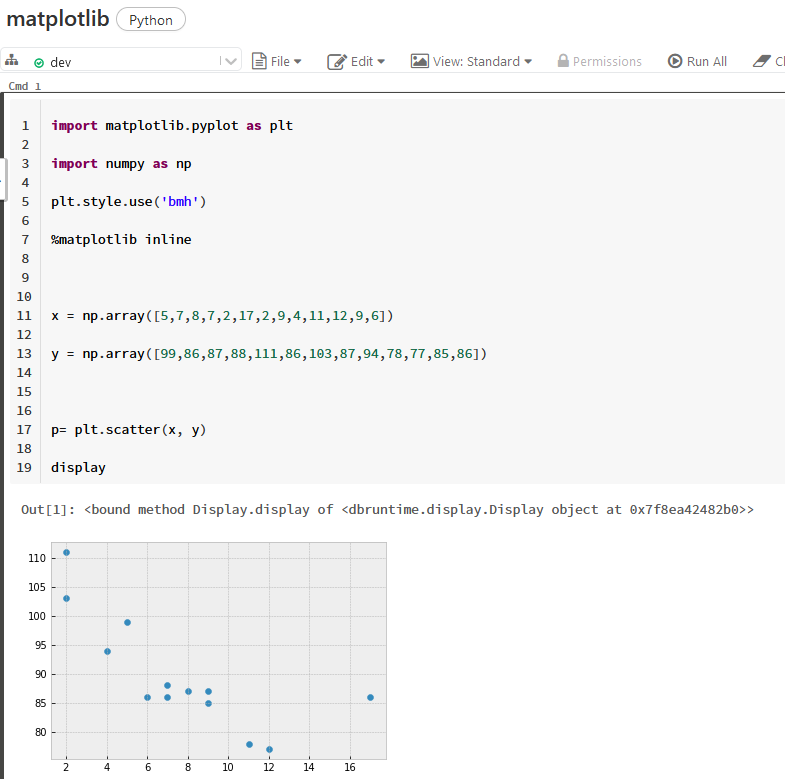
Hi , I have run this code
import matplotlib.pyplot as plt
import numpy as np
plt.style.use('bmh')
%matplotlib inline
x = np.array([5,7,8,7,2,17,2,9,4,11,12,9,6])
y = np.array([99,86,87,88,111,86,103,87,94,78,77,85,86])
p= plt.scatter(x, y)
display
command runs but no result is showing . I am using databricks 7.6 version any help will be greatly appreciated
Labels:
- Labels:
-
Python


1 ACCEPTED SOLUTION
Accepted Solutions
Options
- Mark as New
- Bookmark
- Subscribe
- Mute
- Subscribe to RSS Feed
- Permalink
- Report Inappropriate Content
03-25-2022 03:22 AM
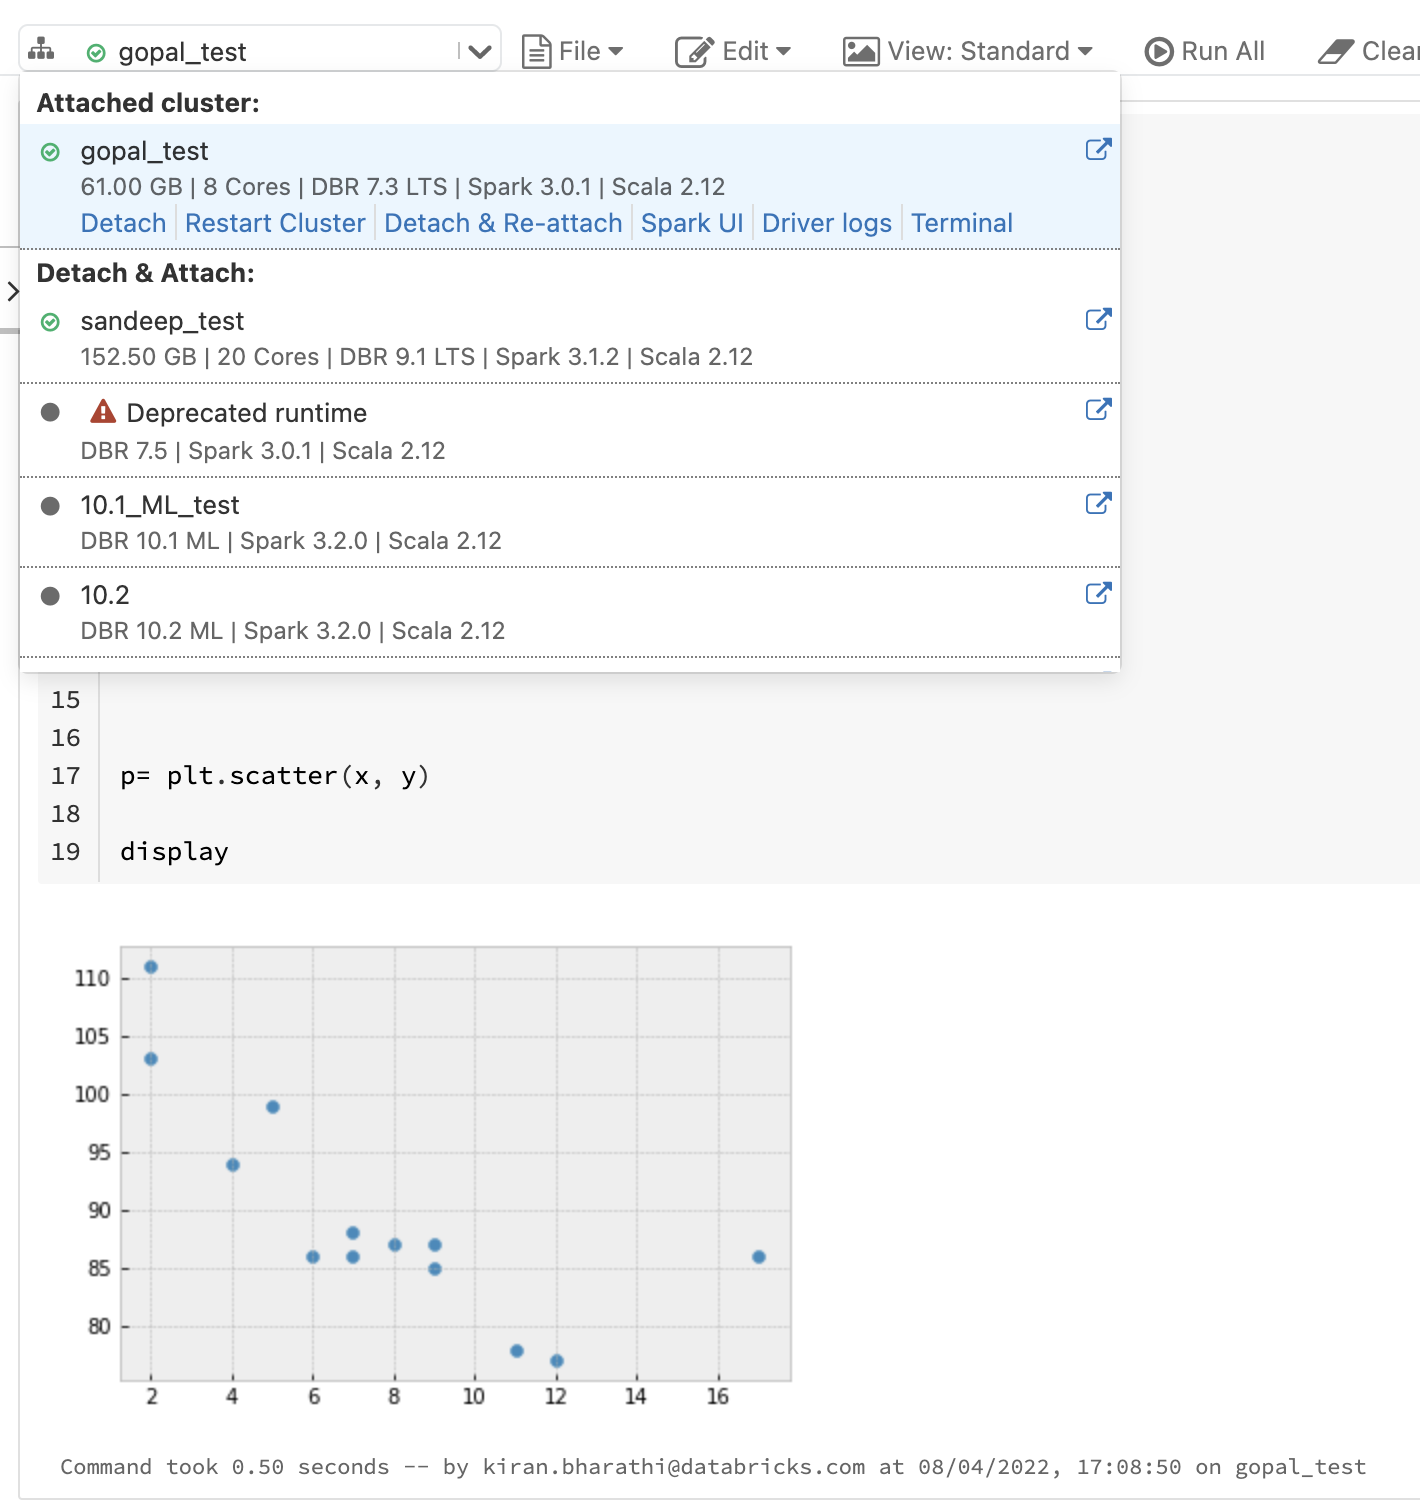
I think you need to upgrade runtime as I've just tested it and it worked like a charm 🙂

My blog: https://databrickster.medium.com/
7 REPLIES 7
Options
- Mark as New
- Bookmark
- Subscribe
- Mute
- Subscribe to RSS Feed
- Permalink
- Report Inappropriate Content
03-25-2022 03:22 AM
Options
- Mark as New
- Bookmark
- Subscribe
- Mute
- Subscribe to RSS Feed
- Permalink
- Report Inappropriate Content
03-25-2022 09:26 AM
can you please explain upgrade runtime? i again try the same command but it show nothing the command execute successfully
Options
- Mark as New
- Bookmark
- Subscribe
- Mute
- Subscribe to RSS Feed
- Permalink
- Report Inappropriate Content
03-25-2022 09:42 AM
i am using 7.3 LTS ML (includes Apache Spark 3.0.1, Scala 2.12)
can you please tell which version are you using
Anonymous
Not applicable
Options
- Mark as New
- Bookmark
- Subscribe
- Mute
- Subscribe to RSS Feed
- Permalink
- Report Inappropriate Content
03-25-2022 11:59 AM
I got it to work on 9.1 LTS
Options
- Mark as New
- Bookmark
- Subscribe
- Mute
- Subscribe to RSS Feed
- Permalink
- Report Inappropriate Content
03-28-2022 07:01 AM
Great to hear. I was using 10.4
My blog: https://databrickster.medium.com/
Options
- Mark as New
- Bookmark
- Subscribe
- Mute
- Subscribe to RSS Feed
- Permalink
- Report Inappropriate Content
04-08-2022 04:43 AM

Options
- Mark as New
- Bookmark
- Subscribe
- Mute
- Subscribe to RSS Feed
- Permalink
- Report Inappropriate Content
04-25-2022 02:36 PM
Hi @Syed Ubaid ,
Just a friendly follow-up. Do you still need help or any of the responses from above help you to resolved your issues? Please let us know.
Announcements


Related Content
- Stop Translating Alteryx Boxes - A Lakebridge-assisted, test-driven migration to Azure Databricks in Data Engineering
- Declarative pipeline full table refresh generates empty MV. in Data Engineering
- Photon not used for the filter step (falls back to COLUMNAR_TO_ROW → FILTER_EXEC in JVM) in Data Engineering
- Python logger.info() not showing inside applyInPandas (but print() works) — why? in Data Engineering
- child Subqueries/sub-statements history metrics, from a parent [CALL...] statement in QueryHistory in Data Governance