Turn on suggestions
Auto-suggest helps you quickly narrow down your search results by suggesting possible matches as you type.
Showing results for
Data Engineering
Join discussions on data engineering best practices, architectures, and optimization strategies within the Databricks Community. Exchange insights and solutions with fellow data engineers.
Turn on suggestions
Auto-suggest helps you quickly narrow down your search results by suggesting possible matches as you type.
Showing results for
- Databricks Community
- Data Engineering
- Understanding Used Memory in Databricks Cluster
Options
- Subscribe to RSS Feed
- Mark Topic as New
- Mark Topic as Read
- Float this Topic for Current User
- Bookmark
- Subscribe
- Mute
- Printer Friendly Page
Understanding Used Memory in Databricks Cluster
Options
- Mark as New
- Bookmark
- Subscribe
- Mute
- Subscribe to RSS Feed
- Permalink
- Report Inappropriate Content
05-21-2023 08:39 PM
Hello,
I wonder if anyone could give me any insights regarding used memory and how could I change my code to "release" some memory as the code runs. I am using a Databricks Notebook.
Basically, what we need to do is perform a query, create a spark sql dataframe and convert to Pandas (yes, I know pandas is not the best but it will have to do for now). The way the code is setup is in a form of a loop that calls a function that performs the steps for each query as according to the user request. The number of queries may vary.
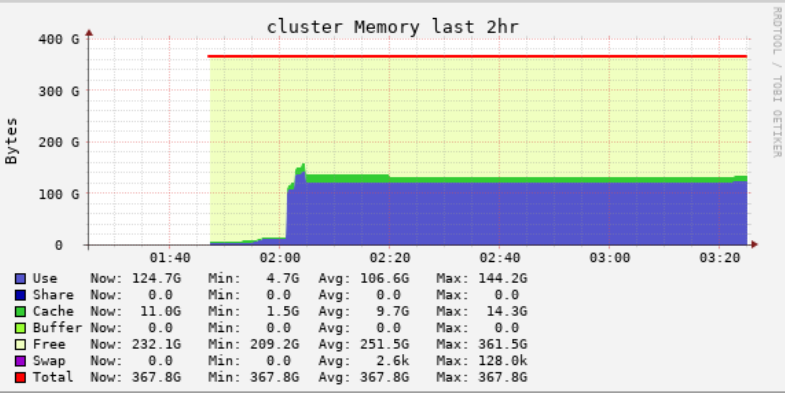
My question is, every time the function is called, I see an increase in memory used. I was expecting that the memory would go down after a loop is finished, but it doesn't. It just keep going up and is never released. It seems like when it reaches about 100-120Gb, then it starts to peak and go back to the 100Gb baseline. Here's a minimal example:
import pandas as pd

def create_query(query):
  query_spark_df = spark.sql(query)
  query_df_pd = query_spark_df.toPandas()
  query_df_pd['col1'] = query_df_pd['col1'].astype('Int16')
  query_df_pd['col2'] = query_df_pd['col2'].astype('int16')
  query_df_pd['col3'] = query_df_pd['col3'].astype('int32')
  #some other preprocessing steps
  #
  #
  return query_df_pd

query_list = [query_1, query_2]
for query in query_list:
  test = create_query(query)
I tried:
- Delete variables using del and gc.collect()
- After being used, I tried to assign other values to the same variables, such as query_spark_df = []
- I tried some spark options such as .unpersist(blocking = True) and spark.catalog.clearCache()
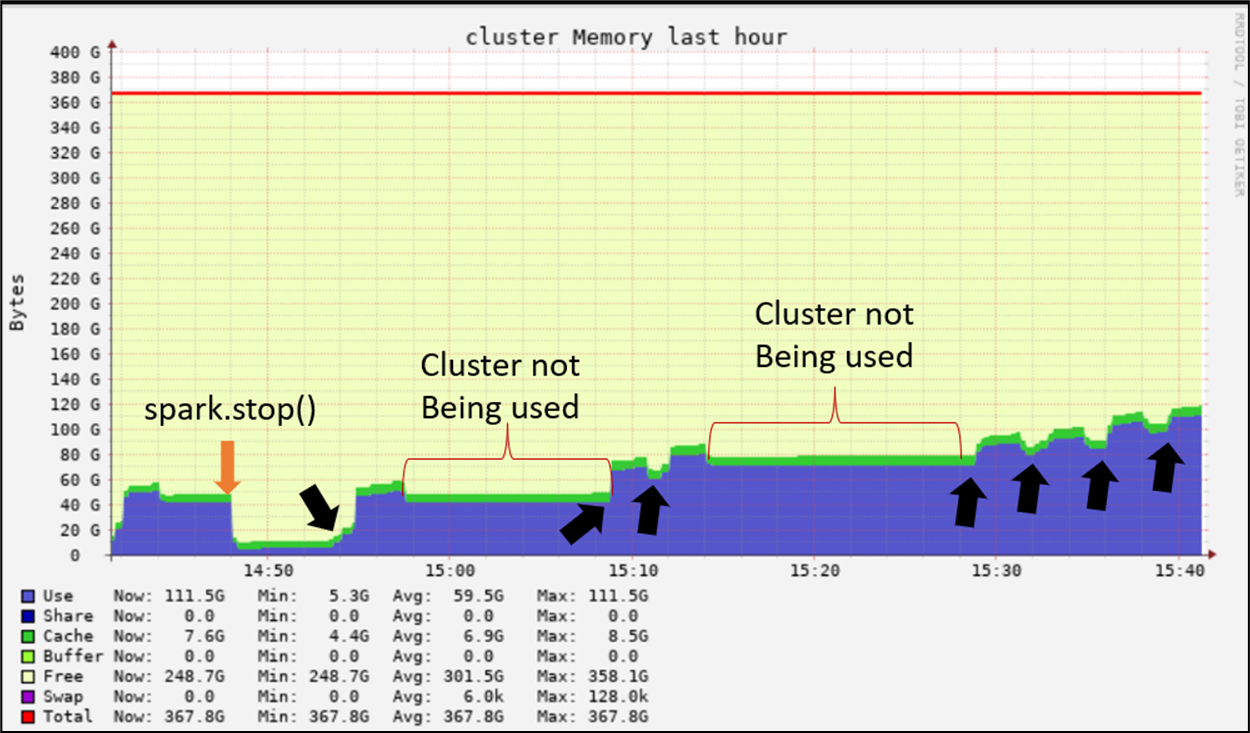
The problem is that after one day of users and us using the cluster, we have something that looks like this:


Is there any spark option that I could add to my "loop" (or at least to the end of my code) that would clear up the used memory? As I mentioned, GC collect has no effect. Should I use the functions differently? Any Python best practice that I am missing? Any help is appreciated.
Labels:
- Labels:
-
Databricks Cluster


4 REPLIES 4
Options
- Mark as New
- Bookmark
- Subscribe
- Mute
- Subscribe to RSS Feed
- Permalink
- Report Inappropriate Content
06-15-2023 11:03 AM
@Juliana Negrini - could you please call the below method multiple times until you see the memory getting decreased to clear the memory?
def NukeAllCaching(tableName: Option[String] = None): Unit = {
  tableName.map { path =>
    com.databricks.sql.transaction.tahoe.DeltaValidation.invalidateCache(spark, path)
  }
  spark.conf.set("spark.databricks.io.cache.enabled", "false")
  spark.conf.set("spark.databricks.delta.smallTable.cache.enabled", "false")
  spark.conf.set("spark.databricks.delta.stats.localCache.maxNumFiles", "1")
  spark.conf.set("spark.databricks.delta.fastQueryPath.dataskipping.checkpointCache.enabled", "false")
  com.databricks.sql.transaction.tahoe.DeltaLog.clearCache()

  spark.sql("CLEAR CACHE")
  sqlContext.clearCache()
}
NukeAllCaching()
The above solution is a kind of patch that requires to be called multiple times. The ideal way is to analyze your code if it is written efficiently in terms of performance, memory usage, and usability.
Options
- Mark as New
- Bookmark
- Subscribe
- Mute
- Subscribe to RSS Feed
- Permalink
- Report Inappropriate Content
06-15-2023 11:10 AM
@Juliana Negrini - with respect to the your sample code, you can use spark's distributed query capabilities to run the query using spark instead of pandas. so, you don't have to toggle between the pandas data frame and the spark data frame.
Options
- Mark as New
- Bookmark
- Subscribe
- Mute
- Subscribe to RSS Feed
- Permalink
- Report Inappropriate Content
07-08-2024 10:59 AM
Did anyone find the solution for mentioned issue?
Options
- Mark as New
- Bookmark
- Subscribe
- Mute
- Subscribe to RSS Feed
- Permalink
- Report Inappropriate Content
02-04-2025 02:13 AM
I have exactly the same kind of problem.
I really do not understand why my driver goes out of memory meanwhile I do not cache anything in Spark.
Since I don't cache anything, I expect references to objects that are not used anymore to be freed.
Even a simple Scala code that read a json on DBFS makes, if I execute it several times in a raw (without stopping the cluster) then the notebook execution will crash with the message:
"The spark driver has stopped unexpectedly and is restarting. Your notebook will be automatically reattached."
I scheduled this notebook execution, and after around 30 executions on DS3v2 (14G RAM, 4 cores), it crash.
This thread deals with the same kind of issue about memory usage when reading json files:
In the comment section, the author of the page says:
"Earlier for each file spark.read.json was called, now spark.read.json is called only one at the root folder. This reduces the number of stages."
But I don't understand why the number of stages would have an impact on the memory?
I have the feeling we can have the same kind of issue when doing SQL query.
I looking for an explanation all around the web, I found many threads with memory consomption issue.
Some people have more or less the same problem that this ticket, but there was no valid answer to their problem.
Lot's of ticket are about cache issue, but one more time, I don't use cache. Nevertheless, I did the following test by adding a cell in my notebook:
spark.catalog.clearCache()
System.gc()
But as I was expecting, it didn't change nothing.
Any help is welcome!
Announcements


Related Content
- Databricks Connect - Will I ever have to Stop clean up Spark session when creating new per request in Data Engineering
- DatabricksConnect from Python/AKS environment calling Databricks Cluster: Spark Query Call Hangs in Data Engineering
- ANALYZE TABLE ... COMPUTE STATISTICS FOR ALL COLUMNS silently does not update column stats on DBR 15 in Data Engineering
- Ingest data from snowflake to databricks in Data Engineering
- SQL Warehouse stuck on "Cluster Start-up Delayed" in Data Engineering