
Turn on suggestions
Auto-suggest helps you quickly narrow down your search results by suggesting possible matches as you type.
Showing results for
Generative AI
Explore discussions on generative artificial intelligence techniques and applications within the Databricks Community. Share ideas, challenges, and breakthroughs in this cutting-edge field.
Turn on suggestions
Auto-suggest helps you quickly narrow down your search results by suggesting possible matches as you type.
Showing results for
- Databricks Community
- Generative AI
- Re: Azure Databricks Genie + Copilot Studio: MCP t...
Options
- Subscribe to RSS Feed
- Mark Topic as New
- Mark Topic as Read
- Float this Topic for Current User
- Bookmark
- Subscribe
- Mute
- Printer Friendly Page
Azure Databricks Genie + Copilot Studio: MCP tools discovered and enabled, but Copilot never invokes

Options
- Mark as New
- Bookmark
- Subscribe
- Mute
- Subscribe to RSS Feed
- Permalink
- Report Inappropriate Content
3 weeks ago
Hi everyone,
I'm trying to integrate an Azure Databricks Genie Agent with Microsoft Copilot Studio through the MCP integration, and I'm stuck in a situation where everything appears correctly configured, but Copilot never actually invokes the Genie tools.
What has already been validated:
- A Genie Agent called "PLANI GENIE" exists in Azure Databricks.
- The Genie Agent is active and has a valid Agent ID.
- The Genie Agent is attached to an active SQL Warehouse.
- Under Unity AI Gateway → MCPs, the MCP appears as Active.
- The MCP type is "Genie Agent".
- The MCP exposes the expected tools:
- query_space_<agent_id>
- poll_response_<agent_id>
- Both tools are visible in Databricks.
On the Copilot Studio side:
- The Azure Databricks connection was created successfully through Power Platform using OAuth authentication
- Connection status is healthy/connected.
- When adding the Azure Databricks Genie tool, Copilot correctly discovers the Genie Space.
- The Genie Space selector appears and I can select "PLANI GENIE".
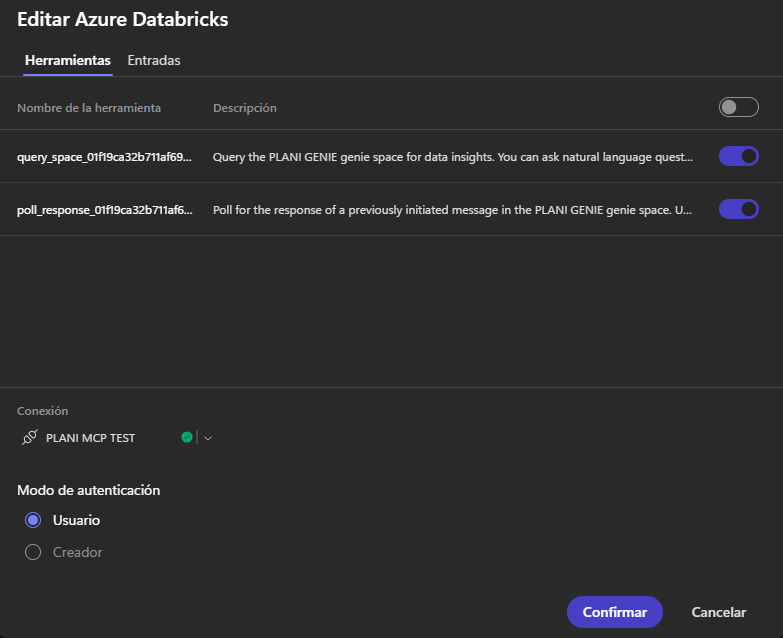
- The tool configuration shows both:
- query_space_<agent_id>
- poll_response_<agent_id>
- Both tools are enabled.
- Authentication mode is set to User.
- The agent has been saved and published after every configuration change.
Agent model:
- Claude Sonnet 4.6
Instructions are intentionally simple. The agent is instructed to use Genie for questions related to CMGs, generation, demand, policies, CAPEX, IFOR, tables and Databricks data, and to never answer from its own knowledge.
Expected behavior:
If I ask something like:
"What is the average CMG for busbar CrucEnc220?"
I would expect Copilot to:
- Call query_space.
- Poll using poll_response.
- Return the Genie response.
Actual behavior:
Instead of invoking Genie, Copilot responds with messages such as:
"I don't have access to Azure Databricks Genie."
"I only have local tools such as bash, grep, file utilities, etc."
"The MCP tools are not available in this environment."
"I cannot access PLANI GENIE."
What confuses me is that Copilot clearly discovers:
- the MCP,
- the Genie Agent,
- the Genie Space,
- query_space,
- poll_response,
yet during execution it behaves as if none of them exist.
At this point I have already verified:
✅ Genie Agent exists
✅ Genie Agent active
✅ Warehouse active
✅ MCP active
✅ MCP tools exposed
✅ Azure Databricks connection healthy
✅ Copilot discovers Genie Space
✅ Copilot discovers query_space
✅ Copilot discovers poll_response
✅ query_space enabled
✅ poll_response enabled
✅ Agent published
My questions are:
- Is there any additional orchestration configuration beyond enabling query_space and poll_response?
- Are there known issues where Copilot discovers the MCP tools but never actually invokes query_space?
Note: I do not have the AI Orchestration setting mentioned in the Databricks documentation. The Genie Agent and MCP tools are configured correctly, but the orchestration option is not present in my Copilot Studio environment.
Any guidance or working examples would be greatly appreciated. Thanks!
Labels:
- Labels:
-
copilot
-
copilot_studio
-
databricks
-
Genie
-
mcp
-
tools


3 REPLIES 3

Options
- Mark as New
- Bookmark
- Subscribe
- Mute
- Subscribe to RSS Feed
- Permalink
- Report Inappropriate Content
2 weeks ago
Your own note near the end, that the AI Orchestration setting isn't present in your environment, is very likely the actual root cause here, more so than anything on the Databricks/MCP side.
The official Databricks integration guide for this exact setup is explicit that this isn't optional: "In the upper-right, click Settings. Under the Orchestration section, click Yes to use AI orchestration for your agent's responses." Without that toggle enabled, my understanding is Copilot Studio falls back to its classic topic/trigger-based flow rather than an LLM-driven planner that can autonomously decide mid-conversation to call an arbitrary tool. That would explain your exact symptom precisely: the MCP tools are correctly registered and discoverable (which is a static/config-time thing), but nothing at runtime is actually deciding to invoke them, because the component that does that deciding is the thing that's missing from your setup.
I don't have a confirmed reason why that Orchestration option itself would be absent from your environment specifically, since Databricks' docs describe it as a standard step rather than something gated. Worth checking whether the agent was created through the same flow the docs assume, since Copilot Studio has more than one agent-creation path and they don't all expose the same Settings panel, and if it's genuinely missing and not just relocated, that's likely a Power Platform tenant/feature-rollout question rather than a Databricks-side one, so Microsoft support or your Power Platform admin center may be able to confirm whether AI orchestration is enabled for your tenant/region.
Separately, and worth doing regardless once orchestration is on: Microsoft's own troubleshooting guidance for "tool discovered but not invoked" also points at the tool's description text specifically, vague descriptions can stop the orchestrator from ever selecting a tool even when orchestration is active. So once you have the setting available, it's worth opening query_space_<agent_id> in the Build tab and giving it an explicit description naming CMGs, generation, demand, policies, CAPEX, IFOR, etc, rather than relying only on your agent-level instructions to carry that context.
Two things point at the same root cause. First, the exact failure mode you're seeing, discovered but never invoked, is Microsoft's own documented troubleshooting entry for agent tools: "Tool not being invoked: Review the tool's description to make sure it clearly describes when the tool should be used. Vague descriptions can prevent the orchestration runtime from selecting the tool." That's from the Copilot Studio docs on managing tools in an agent. Second, your agent's error text, "I only have local tools such as bash, grep, file utilities, etc.", is the signature phrasing of an agent running on the GitHub Copilot harness inside Copilot Studio, a different underlying runtime from the classic Power Virtual Agents-style Copilot engine. On that harness, tool selection is planner-driven off the tool's own description, separate from your agent's system instructions, so instructing the agent to "use Genie for CMGs, generation, demand, policies, CAPEX, IFOR" in its own prompt doesn't help if the query_space_<agent_id> tool itself just has Databricks' generic auto-generated description with none of that domain vocabulary in it.
The fix per the docs: Build tab, Tools panel, select the MCP server, open query_space_<agent_id>, and edit its name/description directly so it explicitly states what it's for, something like "Query the PLANI GENIE space for questions about CMGs, generation, demand, policies, CAPEX, IFOR, or any Databricks table this space covers." Do the same for poll_response_<agent_id> if it has a similarly generic description. That's a per-tool edit in the Tool details dialog, separate from your agent's own instructions field, and it's specifically called out as the fix for "discovered but not invoked."
Worth checking which harness your agent is actually running on if you haven't already, since the fix path differs slightly between the GitHub Copilot harness and the classic Copilot Studio engine, but the underlying cause, orchestrator not being told when to use the tool, is the same either way.
Options
- Mark as New
- Bookmark
- Subscribe
- Mute
- Subscribe to RSS Feed
- Permalink
- Report Inappropriate Content
Tuesday
Same issue here. Just occurs with new Copilot Studio UI. Legacy UI works perfectly.
Is there any workaround to this?
Options
- Mark as New
- Bookmark
- Subscribe
- Mute
- Subscribe to RSS Feed
- Permalink
- Report Inappropriate Content
13 hours ago
@tdcouto That split (new UI broken, legacy UI fine) actually lines up with the harness distinction from my note above. The two Copilot Studio UIs aren't just a skin difference, the new UI runs agents on a different underlying orchestration runtime (the GitHub Copilot-style harness) than the classic engine behind the legacy UI. The legacy engine's topic/trigger-based flow doesn't need an orchestrator to decide when to call a tool, it just runs the configured trigger, so vague tool descriptions and orchestration settings never mattered there. The new UI's planner does need both of those, which is why the exact same MCP setup behaves differently across the two.
Two things worth checking specifically on the new-UI agent (not just copying settings over from the legacy one):
1. Settings > Orchestration is set to Yes on that specific agent. This doesn't always carry over automatically if the agent was migrated or recreated for the new UI rather than edited in place.
2. Open query_space_<agent_id> (and poll_response_<agent_id> if present) under Build > Tools and check whether its description is still the generic Databricks-generated one. The new UI's planner selects tools off that description text, so if it's generic, giving it explicit domain wording (the same fix as above) is worth doing here too even though it worked fine without it on legacy.
If Orchestration genuinely isn't exposed as an option for this agent in the new UI, that's the same gap I couldn't fully explain in my earlier reply, it looks like a Power Platform tenant/rollout inconsistency rather than anything on the Databricks/MCP side. Until that's resolved, the practical workaround is what you're already doing, publish/run from the legacy UI while raising it with Microsoft, since the underlying MCP server and Genie configuration don't need to change between the two.

Announcements


Related Content
- Azure Databricks Genie + Copilot Studio: MCP tools discovered and enabled, but Copilot never invokes in Generative AI
- From STTM to Databricks Pipelines: Can Metadata Become the Source Code of Data Engineering? in Data Engineering
- Private Route53 hosted zone for cloud.databricks.com in Administration & Architecture
- How do I get at the schedules of scheduled queries? in Data Engineering
- SQL queries unable to finish with databricks sql pro warehose in Administration & Architecture