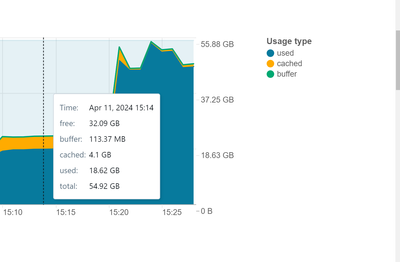
Hi,
I have a single-node personal cluster with 56GB memory(Node type: Standard_DS5_v2, runtime: 14.3 LTS ML). The same configuration is done for the job cluster as well and the following problem applies to both clusters:
To start with: once I start my cluster without attaching anything, I have high memory allocation which 18 GB is used and 4.1 GB is cached. Are all of them just Spark, Python, and my libraries? Is there a way to reduce that as it is 40% of my total memory?

I am using .whl file to include my Python Libraries. Same libraries in my local development with virtual environment(python 3.10) takes 6.1GB space.
For my job, I run the following code piece:
train_index = spark.table("my_train_index_table")
test_index = spark.table("my_test_index_table")

abt_table = spark.table("my_abt_table").where('some_column is not null')
abt_table = abt_table.select(*cols_to_select)

train_pdf = abt_table.join(train_index , on=["index_col"], how="inner").toPandas()
test_pdf = abt_table.join(test_index , on=["index_col"], how="inner").toPandas()
my tables are all delta tables and their size is (from the catalog explorer):
my_train_index_table: 3.4MB - partition:1
my_test_index_table: 870KB - partition:1
my_abt_table: 3.8GB - partition: 40
my_abt_table on pandas after where clause: 5.5GB. This is for analysis purpose, I don't convert this spark df to pandas
my_abt_table on pandas after column selection(lots of String Type): 2.7GB This is for analysis purpose, I don't convert this spark df to pandas.
---
After running the above code cell, 2 pandas frames are created:
train_pdf is 495 MB
test_pdf is 123.7 MB
At this point when I look at the driver logs, I see that GC (Allocation Failure).
My driver info is as follows:

Peak Heap memory is 29GB which I can't make sense in this case.
I tried the following solutions both individually and combined:
1) As Arrow is enabled in my cluster, I added `spark.sql.execution.arrow.pyspark.selfDestruct.enabled True` config to my cluster to free the memory during toPandas() conversion, defined here.
2) Based on this blog I have tried G1GC for garbage collection with `XX:InitiatingHeapOccupancyPercent=35 -XX:ConcGCThread=20` and ended up with GC (Allocation Failure) again.
Based on my trials, I can see that something is blocking the GC to free the memory so eventually I get:
`The spark driver has stopped unexpectedly and is restarting. Your notebook will be automatically reattached.`
My main two question is:
1) Why the initial memory is equal to 40% of my total memory? Is it spark, python and my libraries?
2) With my train_pdf and test_pdf, I would expect `initial memory consumption + my 2 dataframe` more or less, which should be equal to 18.6GB(used)+4.1GB(cached) + 620MB(pandas dataframes), in total 25.3GB. Instead, I end up with 46.2GB(used) + 800MB(cached), in total 47GB. How this is possible?
Is there anything that I cannot see on this? This is a huge blocker for me now.
Thank you!