Turn on suggestions
Auto-suggest helps you quickly narrow down your search results by suggesting possible matches as you type.
Showing results for
Data Engineering
Join discussions on data engineering best practices, architectures, and optimization strategies within the Databricks Community. Exchange insights and solutions with fellow data engineers.
Turn on suggestions
Auto-suggest helps you quickly narrow down your search results by suggesting possible matches as you type.
Showing results for
- Databricks Community
- Data Engineering
- Bamboolib with databricks, low-code programming is...
Options
- Subscribe to RSS Feed
- Mark Topic as New
- Mark Topic as Read
- Float this Topic for Current User
- Bookmark
- Subscribe
- Mute
- Printer Friendly Page
Bamboolib with databricks, low-code programming is now available on #databricks Now you can prepare your databricks code without ... coding. Low code ...
Options
- Mark as New
- Bookmark
- Subscribe
- Mute
- Subscribe to RSS Feed
- Permalink
- Report Inappropriate Content
10-19-2022 06:22 AM
Bamboolib with databricks, low-code programming is now available on #databricks
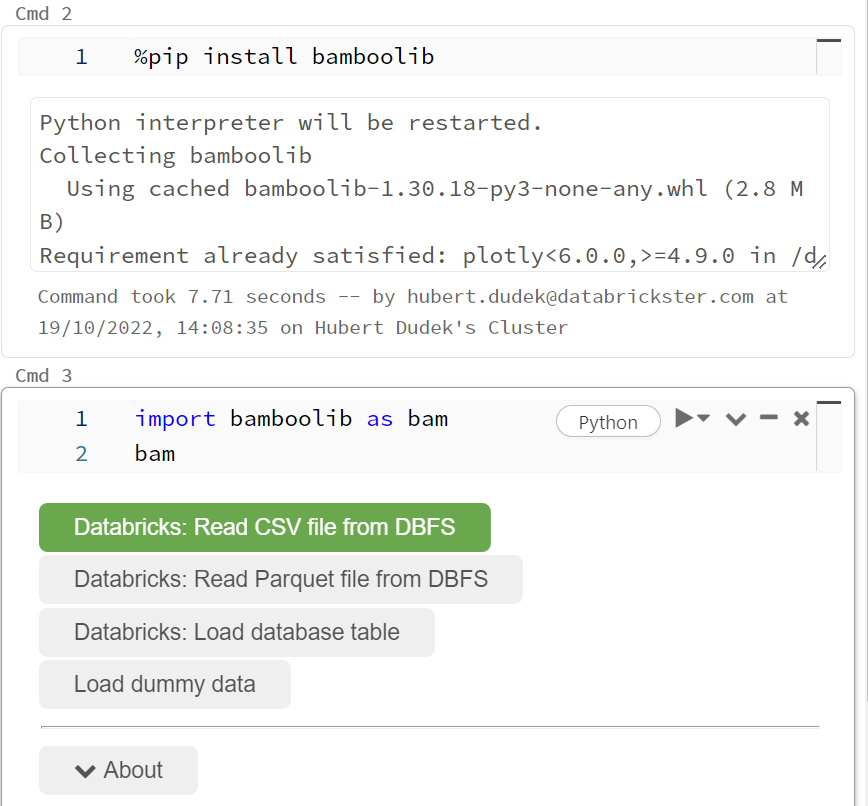
Now you can prepare your databricks code without ... coding. Low code solution is now available on Databricks. Install and import bamboolib to start (require a version of 11 DBR for Azure and AWS, 11.1 for GCC). %pip can be used to install or cluster settings -> “libraries” tab:

- read CSV files,
- read the parquet file,
- read the table from metastore (I bet it will be the most popular option),
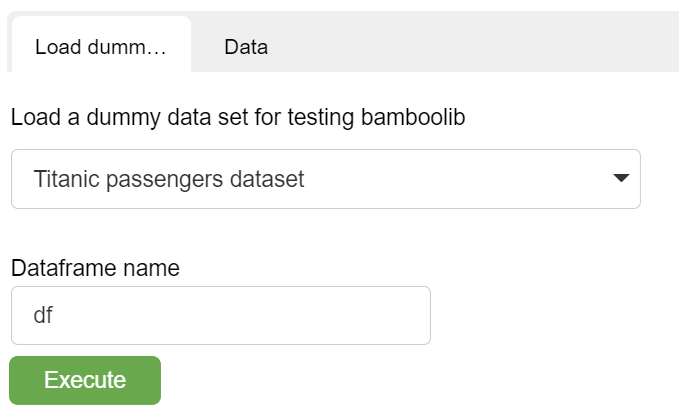
- or use some example dataset with ***** data
We will use an example titanic dataset.


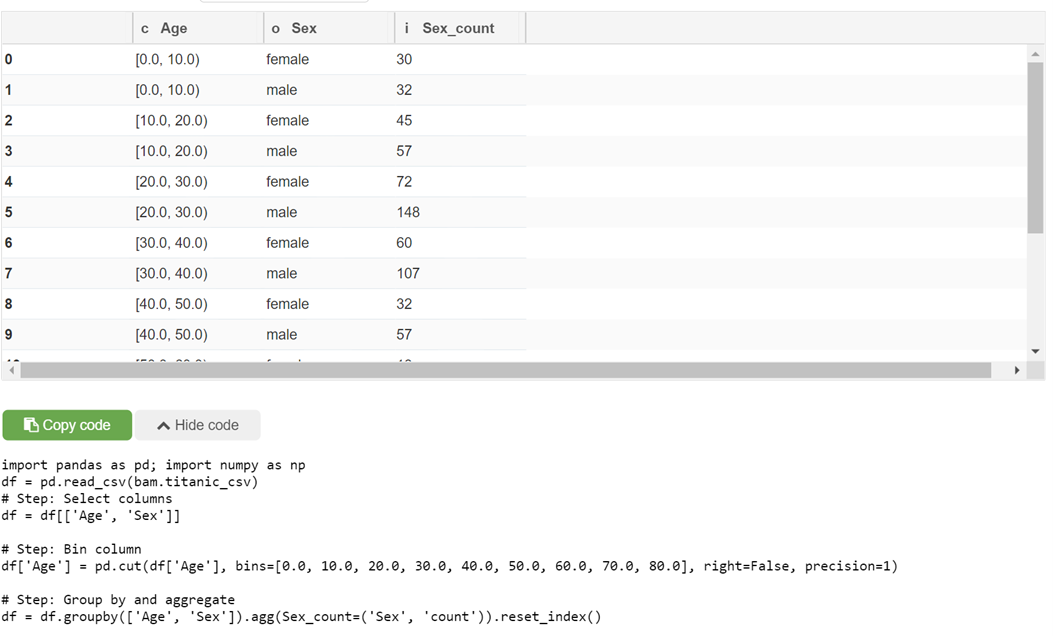
Put age to bins (0-10 years old, 10-20, 20-30, etc.):

Group by and see the result together with the code:

Now we can copy our code and use it in our projects. We can remember replacing pandas with pandas on spark so it will be run distributed way.
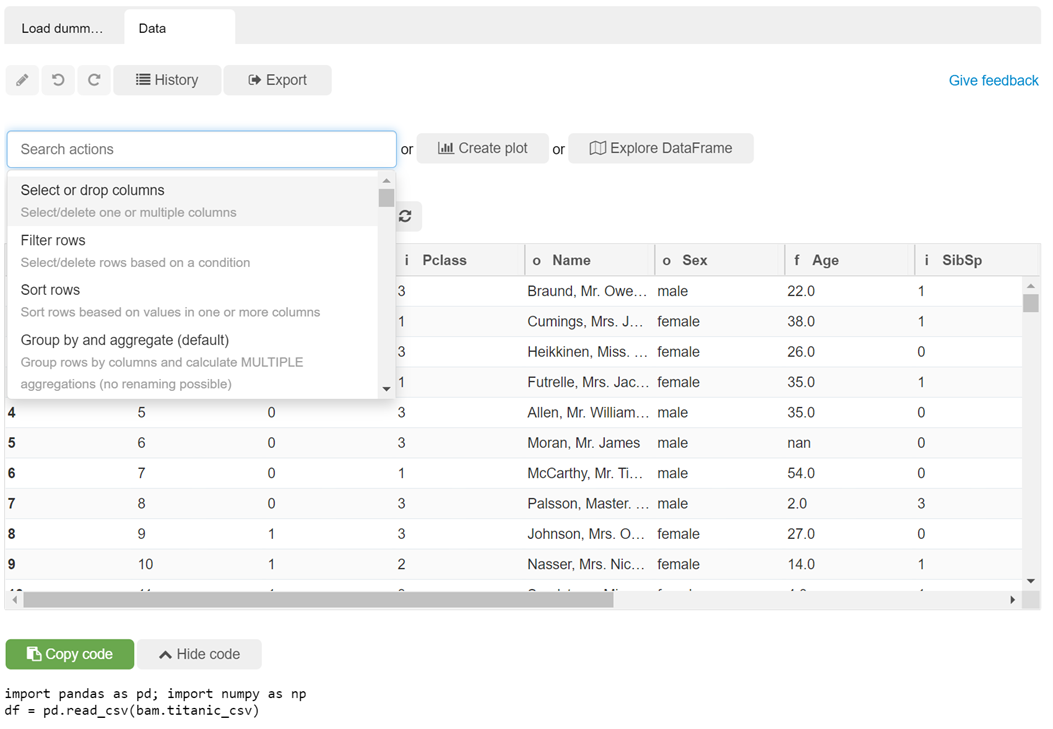
These are example transformations available:
- Select or drop columns,
- Filter rows,
- Sort rows,
- Group by and aggregate,
- Join / merge,
- Change data types,
- Change names,
- Find and replace,
- Conditional replace / if else
- Change DateTime frequency,
- Extract DateTime,
- Move column,
- Bin column,
- Concatenatete,
- Pivot,
- Unpivot,
- Window functions,
- Plot creators
Thanks to the plot creator so we can visualize our data easily.
In the below example, we used a bar plot.

Auto-generated code from the above example is as below:
import pandas as pd; import numpy as np
df = pd.read_csv(bam.titanic_csv)

# Step: Select columns
df = df[['Age', 'Seex']]

# Step: Bin column
df['Age'] = pd.cut(df['Age'], bins=[0.0, 10.0, 20.0, 30.0, 40.0, 50.0, 60.0, 70.0, 80.0], right=False, precision=0)

# Step: Group by and aggregate
df = df.groupby(['Age', 'Seex']).agg(Seex_count=('Seex', 'count')).reset_index()

# Step: Change data type of Age to String/Text
df['Age'] = df['Age'].astype('string')

 import plotly.express as px
fig = px.bar(df, x='Age', y='Seex_count', color='Seex')
fig
My blog: https://databrickster.medium.com/
Labels:
- Labels:
-
Azure
-
Bamboolib
-
databricks


3 REPLIES 3
Options
- Mark as New
- Bookmark
- Subscribe
- Mute
- Subscribe to RSS Feed
- Permalink
- Report Inappropriate Content
10-19-2022 07:13 AM
@Hubert Dudek Informative article, thanks for creating
karthik.p
Options
- Mark as New
- Bookmark
- Subscribe
- Mute
- Subscribe to RSS Feed
- Permalink
- Report Inappropriate Content
10-19-2022 12:56 PM
Thanks
My blog: https://databrickster.medium.com/
Options
- Mark as New
- Bookmark
- Subscribe
- Mute
- Subscribe to RSS Feed
- Permalink
- Report Inappropriate Content
06-29-2023 03:52 AM
I have tried to load parquet file using bamboolib menu, and getting below error that path does not exist
I can load the same file without no problem using spark or pandas using following path
citi_pdf = pd.read_parquet(f'/dbfs/mnt/orbify-sales-raw/WideWorldImportersDW/Dimension_City_new.parquet', engine='pyarrow')

does it work already or still has some bugs ?
AnalysisException: [PATH_NOT_FOUND] Path does not exist: dbfs:/dbfs/mnt/orbify-sales-raw/WideWorldImportersDW/Dimension_City_new.parquet.


Full stack trace:
-----------------------------
Traceback (most recent call last):
File "/local_disk0/.ephemeral_nfs/cluster_libraries/python/lib/python3.9/site-packages/bamboolib/helper/gui_outlets.py", line 346, in safe_execution
hide_outlet = execute_function(self, *args, **kwargs)
File "/local_disk0/.ephemeral_nfs/cluster_libraries/python/lib/python3.9/site-packages/bamboolib/setup/module_view.py", line 365, in open_parquet
df = exec_code(code, symbols=self.symbols, result_name=df_name)
File "/local_disk0/.ephemeral_nfs/cluster_libraries/python/lib/python3.9/site-packages/bamboolib/helper/utils.py", line 446, in exec_code
exec(code, exec_symbols, exec_symbols)
File "", line 1, in
File "/databricks/spark/python/pyspark/instrumentation_utils.py", line 48, in wrapper
res = func(*args, **kwargs)
File "/databricks/spark/python/pyspark/sql/readwriter.py", line 533, in parquet
return self._df(self._jreader.parquet(_to_seq(self._spark._sc, paths)))
File "/databricks/spark/python/lib/py4j-0.10.9.5-src.zip/py4j/java_gateway.py", line 1321, in __call__
return_value = get_return_value(
File "/databricks/spark/python/pyspark/errors/exceptions.py", line 234, in deco
raise converted from None
pyspark.errors.exceptions.AnalysisException: [PATH_NOT_FOUND] Path does not exist: dbfs:/dbfs/mnt/orbify-sales-raw/WideWorldImportersDW/Dimension_City_new.parquet.
Announcements


Related Content
- Genie One – Unable to Extract Usage Details in Warehousing & Analytics
- Genie Space and App Error in Data Engineering
- How to change passkey device for partner-academy.databricks.com? in Administration & Architecture
- SPOG discovery probe failed in Administration & Architecture
- Trunked-based development model for Databricks question in Data Engineering