cancel
Showing results for 
Search instead for 
Did you mean: 
Data Engineering
cancel
Showing results for 
Search instead for 
Did you mean: 

Dashboard always display truncated data

RabahO
New Contributor III

Hello, 

we're working with a serverless SQL cluster to query Delta tables and display some analytics in dashboards. 

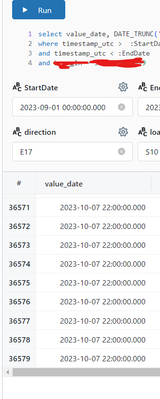
We have some basic group by queries that generate around 36k lines, and they are executed without the "limit" key word. So in the data tab we can see all the results, yet when we switch to the graphics/dashboard tab "truncated data" is written under every graphic. 
RabahO_0-1714985064998.png

RabahO_1-1714985222841.png


We didn't find any button to display the full data. 

The cluster is a 2xs but it did display everything a couple of weeks ago which is weird, I don't know if there was a DBX update or something I'm missing. How can we force display everything even if the cluster has to crash? we will consider upscaling if that's the issue

2 REPLIES 2

mhiltner
New Contributor II
New Contributor II

Hey @RabahO

This is likely a memory issue. 

The current behavior is that Databricks will only attempt to display the first 64000 rows of data. If the first 64000 rows of data are larger than 2187 MB, then it will fail to display anything. In your case, you still get 10k rows, so somehow it is not failing completely. I'd try reducing number of columns temporarily just to check whether it is a memory issue.

You could also try to check the query profile and see if it shows the moment it truncates to 10000 rows if there's an explanation.  

RabahO
New Contributor III

Yes I read the documentation that says it truncates at 64k rows, but as you can see I only have 36k row in total and only 10k are displayed, also, the data is really small, 36k row on 5 columns. I can't see that reaching 2187MB. 

I reduced the query to its minimum to be useful but nothing. It's a time series, when aggregated daily it does display everything but when in hourly it only displays 10k...