Turn on suggestions
Auto-suggest helps you quickly narrow down your search results by suggesting possible matches as you type.
Showing results for
Technical Blog
Explore in-depth articles, tutorials, and insights on data analytics and machine learning in the Databricks Technical Blog. Stay updated on industry trends, best practices, and advanced techniques.
Turn on suggestions
Auto-suggest helps you quickly narrow down your search results by suggesting possible matches as you type.
Showing results for
- Databricks Community
- Technical Blog
- From Idea to Code: Building with the Databricks SD...
Databricks Employee
Options
- Subscribe to RSS Feed
- Mark as New
- Mark as Read
- Bookmark
- Subscribe
- Printer Friendly Page
- Report Inappropriate Content
02-01-2024
11:15 AM
Over the past six months I've worked with many folks - helping answer questions or creating bespoke code snippets for their projects. We have robust documentation for the SDK as well as a repository of examples, but, there are not examples for every single thing you may want to do with the SDK. So, I figured it will benefit some folks to walk through how I approached familiarizing myself with the codebase and how to develop new projects quickly.
The focus of this blog is to demystify the Python SDK - the authentication process and the components of the SDK by walking through the start-to-end development process. I'll also be showing how to utilize IntelliSense and the Debugger for real-time suggestions in order to reduce the amount of context-switching from the IDE to documentation and code examples.
What is the Databricks SDK for Python
And why you should use it
The Databricks Python SDK lets you interact with the Databricks Platform programmatically using Python. It covers the entire Databricks API surface and Databricks REST operations. While you can interact directly with the API via curl or a library like 'requests' there are benefits to utilizing the SDKs such as:
- Secure and simplified authentication via Databricks client-unified authentication
- Built-in debug logging with sensitive information automatically redacted
- Support to wait for long-running operations to finish (kicking off a job, starting a cluster)
- Standard iterators for paginated APIs (we have multiple pagination types in our APIs!)
- Retrying on transient errors
There are numerous practical applications, such as building multi-tenant web applications that interact with your ML models or a robust UC migration toolkit like Databricks Labs project UCX. Don’t forget the silent workhorses; those simple utility scripts that are more limited in scope but automate an annoying task such as bulk updating cluster policies, dynamically adding users to groups, or simply writing data files to UC Volumes. Implementing these types of scripts is a great way to familiarize yourself with the Python SDK and Databricks APIs.
Scenario
Imagine my business is establishing best practices for development and CI/CD on Databricks. We're adopting DABs to help us define and deploy workflows in our development and production Workspaces, but in the meantime, we need to audit and clean up our current environments. We have a lot of jobs people created in our dev Workspace via the UI. One of the platform admins observed many of these jobs are inadvertently configured to run on a recurring schedule, racking up unintended costs. As part of the clean-up process, we want to identify any scheduled jobs in our development Workspace with an option to pause them. We’ll need to figure out:
- How to install the SDK
- How to connect to the Databricks Workspace
- How to list all the jobs and examine their attributes
- How to log the problematic jobs - or a step further, how to call the API to pause their schedule
Development environment
Before diving into the code, you need to set up your development environment. I highly recommend using an IDE that has a comprehensive code completion feature as well as a debugger. Code completion features, such as Intellisense in VS Code, are really helpful when learning new libraries or APIs - they provide useful contextual information, autocompletion, and aid in code navigation. For this blog, I’ll be using Visual Studio Code so I can also make use of the Databricks Extension as well as Pylance. You’ll also need to install the databricks-sdk (docs). In this blog, I’m using Poetry + Pyenv. The setup is similar for other tools - just 'poetry add databricks-sdk' or alternatively 'pip install databricks-sdk' in your environment.
Authentication
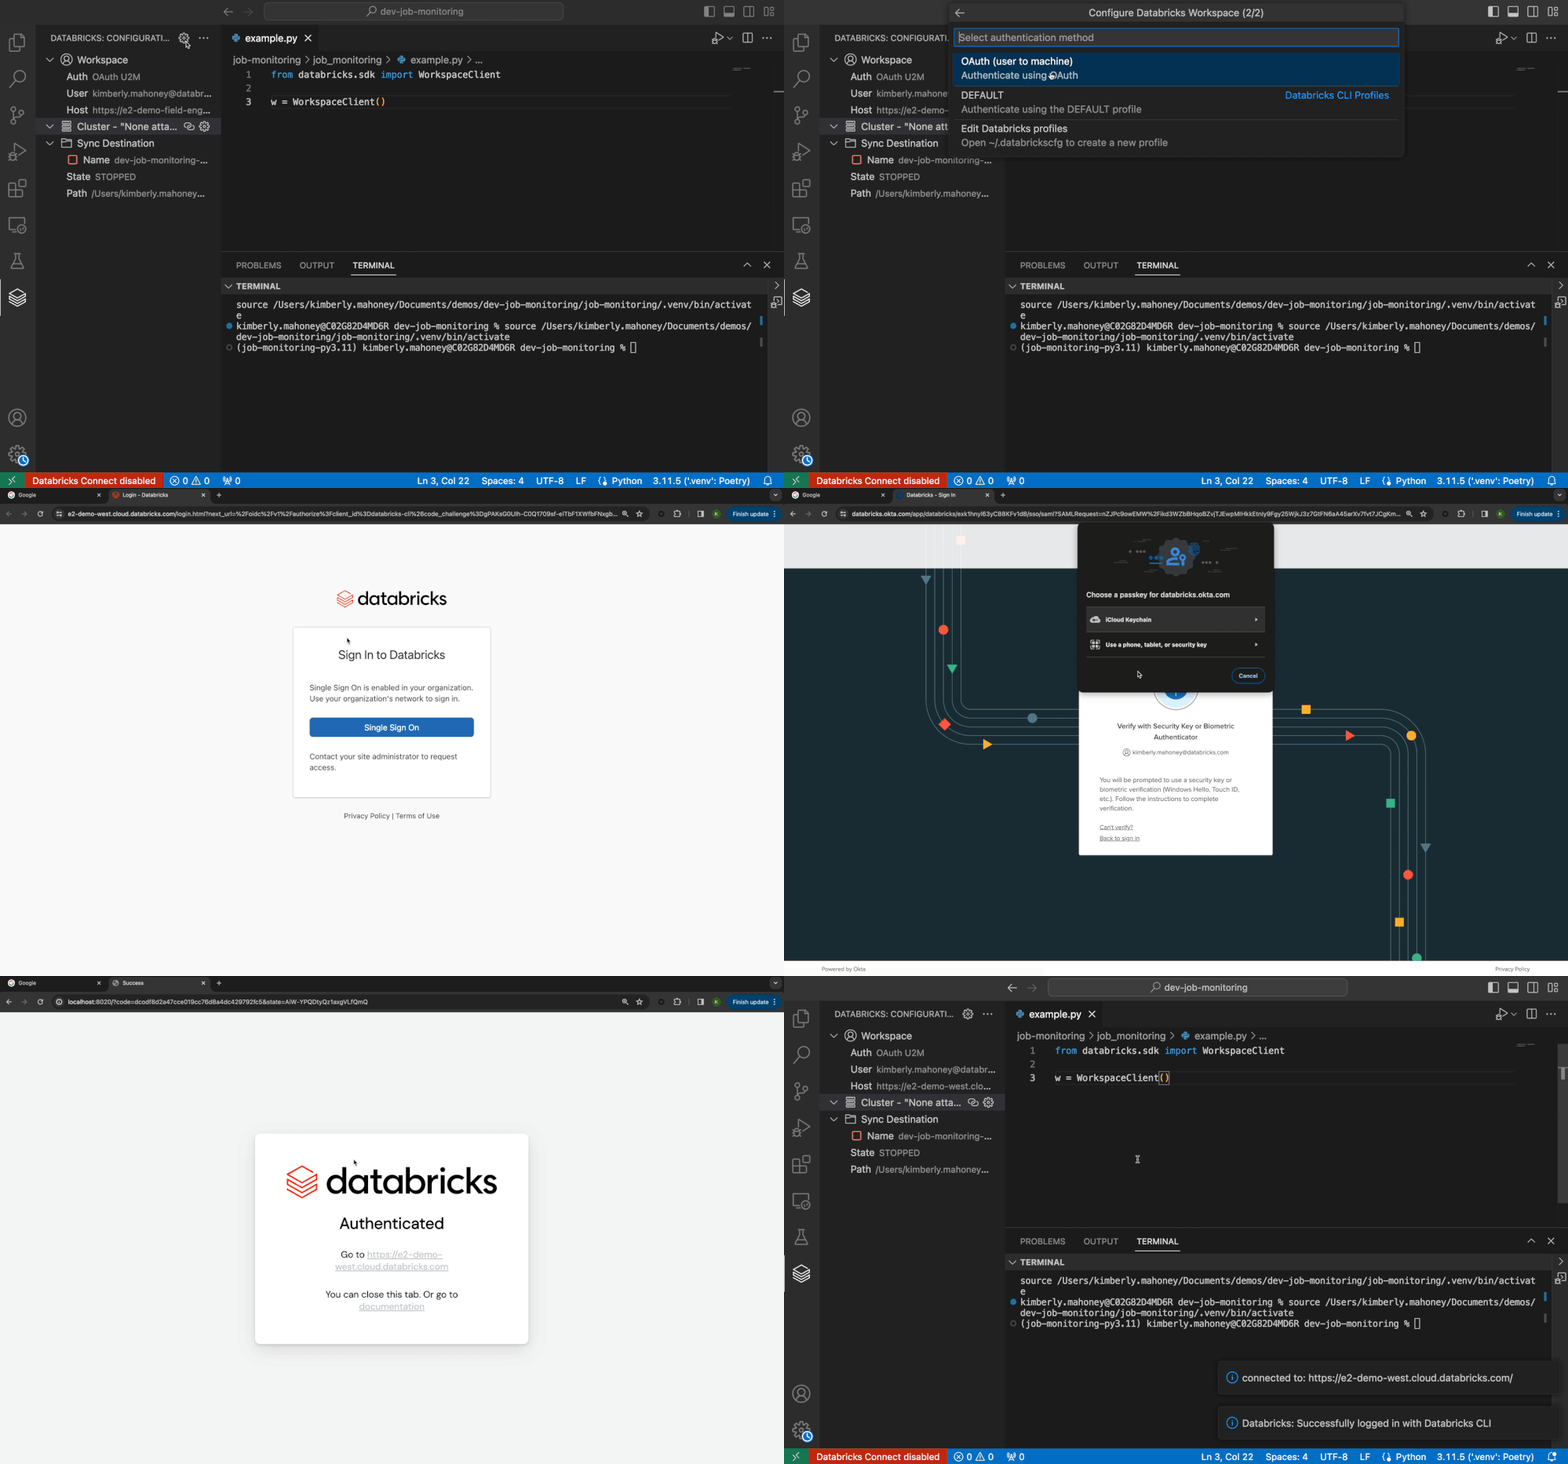
The next step is to authorize access to Databricks so we can work with our Workspace. There are several ways to do this, but because I’m using the VS Code Extension I’ll take advantage of its authentication integration. It’s one of the tools that uses unified client authentication - that just means all these development tools follow the same process and standards for authentication and if you set up auth for one you can reuse it amongst the other tools. I set up both the CLI and VS Code Extension previously, but here is a primer on setting up the CLI and installing the extension. Once you’ve connected successfully you’ll see a notification banner in the lower right-hand corner and see two hidden files generated in the .databricks folder - project.json and databricks.env (don’t worry, the extension also handles adding these to .gitignore).
For this example, while we’re interactively developing in our IDE we’ll be using what’s called U2M (user-to-machine) OAuth. We won’t get into the technical details, but OAuth is a secure protocol that handles authorization to resources without passing sensitive user credentials such as PAT or username/password that persist much longer than the one-hour short-lived OAuth token.
WorkspaceClient vs. AccountClient
The Databricks API is split into two primary categories - Account and Workspace. They let you manage different parts of Databricks, like user access at the account level or cluster policies in a Workspace. The SDK reflects this with two clients that act as our entry points to the SDK - the WorkspaceClient and AccountClient. For our example we’ll be working at the Workspace level so I’ll be initializing the WorkspaceClient. If you're unsure which client to use, check out the SDK documentation.
💡Because we ran the previous steps to authorize access via unified client auth, the SDK will automatically use the necessary Databricks environment variables, so there's no need for extra configurations when setting up your client. All we need are these two lines of code:
- Initializing our WorkspaceClient
from databricks.sdk import WorkspaceClient

w = WorkspaceClient()
Making API calls and interacting with data
The Workspace client we instantiated will allow us to interact with different APIs across the Databricks Workspace services. A service is a smaller component of the Databricks Platform i.e. Jobs, Compute, Model Registry. In our example, we’ll need to call the Jobs API in order to retrieve a list of all the jobs in the Workspace.

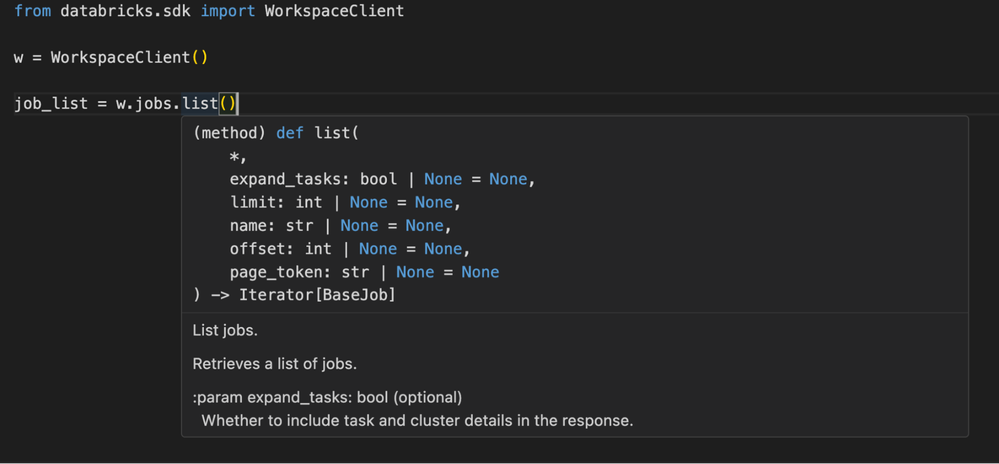
This is where Intellisense really comes in handy. Instead of context switching between the IDE and the Documentation page I can use autocomplete to provide a list of methods as well as examine the method description, the parameters, and return types from within the IDE. I know the first step is getting a list of all the jobs in the Workspace:
As you can see it returns an iterator over an object called BaseJob. Before we talk about what a BaseJob actually is it’ll be helpful to understand how data is used in the SDK. To interact with data you are sending to and receiving from the API, the Python SDK takes advantage of Python Data Classes and Enums. The main advantage of this approach over passing around dictionaries is improved readability while also minimizing errors through enforced type checks and validations.
You can construct objects with Data Classes and interact with enums. For example:
- Creating an Employee via Employee DataClass and company departments, using Enums for possible department values
from dataclasses import dataclass
from enum import Enum
from typing import Optional

class CompanyDepartment(Enum):
    MARKETING = 'MARKETING'
    SALES = 'SALES'
    ENGINEERING = 'ENGINEERING'

@dataclass
class Employee:
    name: str
    email: str
    department: Optional[CompanyDepartment] = None


emp = Employee('Bob', 'bob@company.com', CompanyDepartment.ENGINEERING)
In the Python SDK all of the data classes, enums, and APIs belong to the same module for a service located under databricks.sdk.service - e.g. databricks.sdk.service.jobs, databricks.sdk.service.billing, databricks.sdk.service.sql.
For our example, we'll need to loop through all of the jobs and make a decision on whether or not they should be paused. I'll be using a debugger in order to look at a few example jobs and get a better understanding of what a ‘BaseJob’ looks like. The Databricks VS Code extension comes with a debugger that can be used to troubleshoot code issues interactively on Databricks via Databricks Connect. But, because I do not need to run my code on a cluster I'll just be using the standard Python debugger. I’ll set a breakpoint inside my for loop and use the VS Code Debugger to examine a few examples. A breakpoint allows us to stop code execution and interact with variables during our debugging session. This is preferable over print statements, as you can use the debugging console to interact with the data as well as progress the loop. In this example I’m looking at the settings field and drilling down further in the debugging console to take a look at what an example job schedule looks like:
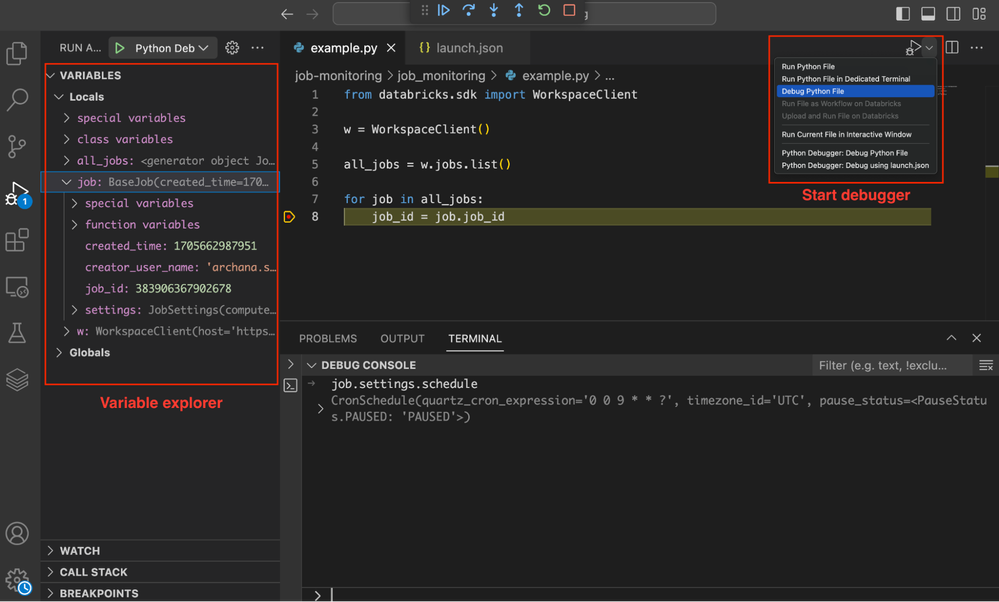
We can see a BaseJob has a few top-level attributes and has a more complex Settings type that contains most of the information we care about. At this point, we have our Workspace client and are iterating over the jobs in our Workspace. To flag problematic jobs and potentially take some action we’ll need to better understand job.settings.schedule. We need to figure out how to programmatically identify if a job has a schedule and flag if it’s not paused. For this we’ll be using another handy utility for code navigation - Go to Definition. I’ve opted to Open Definition to the Side (⌘K F12) in order to reduce switching to a new window. This will allow us to quickly navigate through the DataClass definitions without having to switch to a new window or exit our IDE:
As we can see, a BaseJob contains some top-level fields that are common amongst Jobs such as 'job_id' or 'created_time'. A job can also have various settings (JobSettings). These configurations often differ between Jobs and encompass aspects like notification settings, tasks, tags, and the schedule. We’ll be focusing on the schedule field, which is represented by the CronSchedule data class. CronSchedule contains information about the pause status (PauseStatus) of a job. PauseStatus in the SDK is represented as an enum with two possible values - PAUSED and UNPAUSED.
💡Tip: VSCode + Pylance provides code suggestions and you can enable auto imports in your User Settings or on a per-project basis in Workspace Settings. By default, only top-level symbols are suggested for auto import and suggested code (see original GitHub issue). However, the SDK has nested elements we want to generate suggestions for. We actually need to go down 5 levels - databricks.sdk.service.jobs.<Enum|Dataclass>. In order to take full advantage of these features for the SDK I added a couple of Workspace settings:
- Selection of theVSCode Workspace settings.json
...
  "python.analysis.autoImportCompletions": true,
  "python.analysis.indexing": true,
 "python.analysis.packageIndexDepths": [
{
            "name": "databricks",
            "depth": 5,
            "includeAllSymbols": true
        }
]
...
Putting it all together:
I broke out the policy logic into its own function for unit testing, added some logging, and expanded the example to check for any jobs tagged as an exception to our policy. Now we have:
- Logging out of policy jobs
import logging from databricks.sdk import WorkspaceClient from databricks.sdk.service.jobs import CronSchedule, JobSettings, PauseStatus # Initialize WorkspaceClient w = WorkspaceClient() def update_new_settings(job_id, quarts_cron_expression, timezone_id): """Update out of policy job schedules to be paused""" new_schedule = CronSchedule( quartz_cron_expression=quarts_cron_expression, timezone_id=timezone_id, pause_status=PauseStatus.PAUSED, ) new_settings = JobSettings(schedule=new_schedule) logging.info(f"Job id: {job_id}, new_settings: {new_settings}") w.jobs.update(job_id, new_settings=new_settings) def out_of_policy(job_settings: JobSettings): """Check if a job is out of policy. If it unpaused and has a schedule and is not tagged as keep_alive Return true if out of policy, false if in policy """ tagged = bool(job_settings.tags) proper_tags = tagged and "keep_alive" in job_settings.tags paused = job_settings.schedule.pause_status is PauseStatus.PAUSED return not paused and not proper_tags all_jobs = w.jobs.list() for job in all_jobs: job_id = job.job_id if job.settings.schedule and out_of_policy(job.settings): schedule = job.settings.schedule logging.info( f"Job name: {job.settings.name}, Job id: {job_id}, creator: {job.creator_user_name}, schedule: {schedule}" ) ....
Now we have not only a working example but also a great foundation for building out a generalized job monitoring tool. We're successfully connecting to our Workspace, listing all the jobs, and analyzing their settings, and, when we're ready, we can simply call our `update_new_settings function` to apply the new paused schedule. It's fairly straightforward to expand this to meet other requirements you may want to set for a Workspace - for example, swap job owners to service principles, add tags, edit notifications, or audit job permissions. See the example in the GitHub repository.
Scheduling a job on Databricks
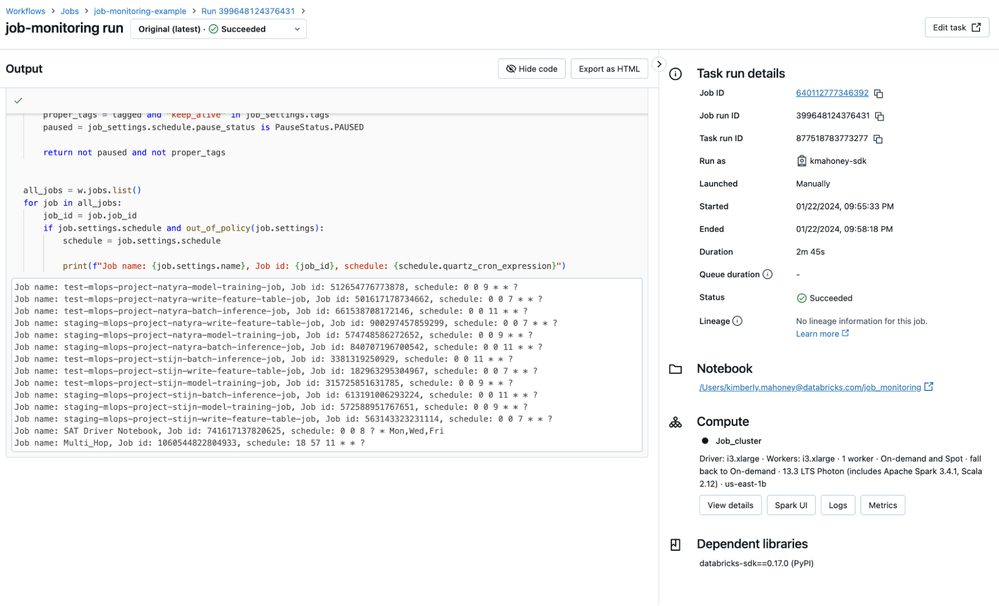
You can run your script anywhere, but you may want to schedule scripts that use the SDK to run as a Databricks Workflow or job on a small single-node cluster. When running a Python notebook interactively or via automated workflow you can take advantage of default Databricks Notebook authentication. If you're working with the Databricks Workspace client and your cluster meets the requirements listed in the docs you can initialize your WorkspaceClient without needing to specify any other configuration options or environment variables - it works automatically out of the box.
Conclusion
In conclusion, the Databricks SDKs offer limitless potential for a variety of applications. We saw how the Databricks SDK for Python can be used to automate a simple yet crucial maintenance task and also saw an example of an OSS project that uses the Python SDK to integrate with the Databricks Platform. Regardless of the application you want to build, the SDKs streamline development for the Databricks Platform and allow you to focus on your particular use case. The key to quickly mastering a new SDK such as the Databricks Python SDK is setting up a proper development environment. Developing in an IDE allows you to take advantage of features such as a debugger, parameter info, and code completion, so you can quickly navigate and familiarize yourself with the codebase. Visual Studio Code is a great choice for this as it provides the above capabilities and you can utilize the VSCode extension for Databricks to benefit from unified authentication.
Any feedback is greatly appreciated and welcome. Please raise any issues in the Python SDK GitHub repository. Happy developing!
Additional resources:
- Databricks SDK for Python Documentation
- DAIS Presentation: Unlocking the Power of Databricks SDKs
- How to install Python libraries in your local development environment: How to Create and Use Virtual Environments in Python With Poetry
- Installing the Databricks extension for Visual Studio Code
3 Comments
You must be a registered user to add a comment. If you've already registered, sign in. Otherwise, register and sign in.
Related Content
- Azure Databricks — Reverse SSH Tunnel for On-Premises Connectivity in Technical Blog
- Learning Series | Data Preparation for Machine Learning in Announcements
- Stripe + Databricks: Finally, Real-Time Payments Data Without the Headache in MVP Articles
- DataHacks 2026: University Alliance in Action at UCSD in Community Articles
- Community Alert: Free BrickTalk on Supply Chain Management with Databricks! in Announcements
