


Turn on suggestions
Auto-suggest helps you quickly narrow down your search results by suggesting possible matches as you type.
Showing results for
Technical Blog
Explore in-depth articles, tutorials, and insights on data analytics and machine learning in the Databricks Technical Blog. Stay updated on industry trends, best practices, and advanced techniques.
Turn on suggestions
Auto-suggest helps you quickly narrow down your search results by suggesting possible matches as you type.
Showing results for
- Databricks Community
- Technical Blog
- Ray Monitoring Made Easy: Prometheus & Grafana wit...
Databricks Employee
Options
- Subscribe to RSS Feed
- Mark as New
- Mark as Read
- Bookmark
- Subscribe
- Printer Friendly Page
- Report Inappropriate Content
02-09-2025
10:34 PM
Intro
Ray is rapidly becoming the standard for logic-parallel computing, enabling many Databricks customers to accelerate a wide range of Python workloads. Since its general availability on Databricks in early 2024, Ray on Databricks has opened up new possibilities for cluster-based computing on the platform.
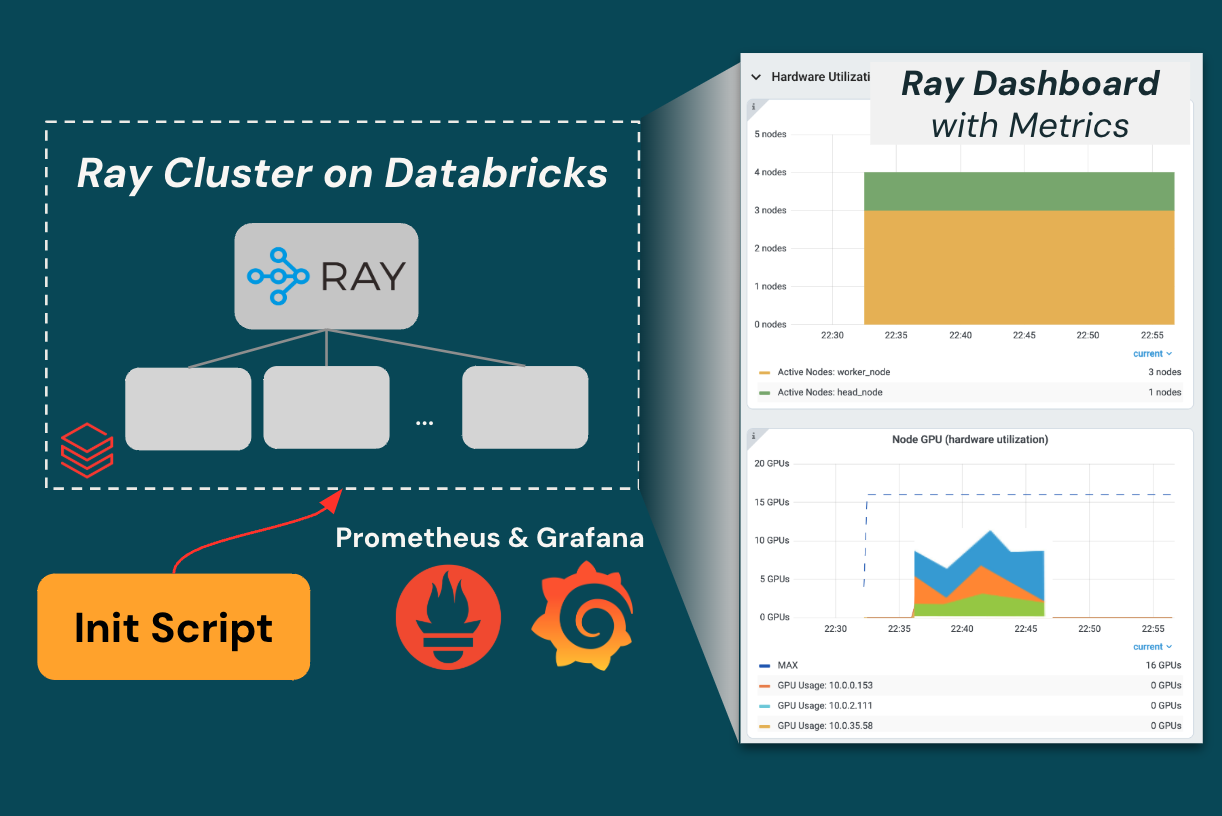
Effective management of distributed cluster infrastructure relies heavily on observability and monitoring. The open-source Ray dashboard is a vital tool for Ray developers, providing a web-based interface that visualizes system state, facilitates monitoring and debugging of Ray applications, and helps track performance and troubleshoot issues.
Launching a Ray on Databricks cluster provides the basic features of the Ray dashboard, including job status, task details, and cluster node monitoring. In order to support hardware-level details for a running cluster that feeds into the Metrics View, this blog outlines a simple script to set up Prometheus and Grafana.
[Recommended] Prometheus+Grafana Setup on Databricks Ray cluster
The process described below can be used to setup a Prometheus+Grafana on an already-running Ray on Spark cluster. This is the most common way Ray is used on Databricks: either on an interactive All Purpose or dedicated Job cluster, a Ray cluster is initialized using the already-existing Spark context. A lightweight shell script is then used to start Prometheus+Grafana.
- Review the init script available at this Github location: setup_monitoring.sh
- Note: The init script is provided under the DB License. Subject to the license terms, the code is provided as-is with no warranties and you may use it as-is or extend/customize it as needed.
- See the accompanying notebook for instructions on how to run via magic %sh command: prometheus-metrics-with-ray-dashboard.ipynb.
- After initializing the Ray on Spark cluster, run the uploaded/cloned script via %sh ./setup_monitoring.sh, then check out the Ray dashboard to see live cluster metrics!
- See this blog for best practices on cluster setup: Ray on Spark: A Practical Architecture and Setup Guide
You can use this approach on a Global or Local Ray cluster, and adapt to any enterprise monitoring/logging standards at your organization. This lightweight process can also be used for large Ray on Databricks deployments: put the script centrally in a workspace or UC Volume, then use it from within many automated jobs that create their own or re-use an existing Ray on Spark cluster.
[Legacy] Init Script-based Setup Process
Spoiler
NOTE: as of September 2025, Databricks no longer recommends using init scripts. The section below is preserved for reference only, but we recommend using the approach detailed above.
The script below initializes a Global Ray Cluster that can be shared by multiple Ray applications and/or multiple users. Note the important steps below, including how developers should connect to the cluster with the ray.init() command. Complete the following steps to use this approach:
- Review the init script available at this Github location.
- Note: The init script is provided under the DB License. Subject to the license terms, the code is provided as-is with no warranties and you may use it as-is or extend/customize it as needed.
- Upload .sh init script to your Databricks workspace or UC Volume (init script docs)
- Create a cluster to be used for Ray applications (see recommendations below)
- Under Advanced, add the init script from Step 1 using its full file path:
- If you are using a multi-node Ray cluster, add the environment variable RAY_MAX_WORKERS=<max workers>
- Note: If using Spark+Ray together, review best practices for resource sharing and set RAY_MAX_WORKERS env variable to a number less than the total workers so Spark SQL tasks are not starved of resources.
-
- Start the cluster. The cluster will take several extra minutes to start as the Ray on Spark cluster initializes and Prometheus+Grafana are set up.
- Navigate to the Ray Dashboard. The easiest way to find this unique URL is:
- On the cluster page, go to Apps tab → Web Terminal. Copy the URL from the Web Terminal. It should look something like: https://…/driver-proxy/o/…/{cluster_id}/7681?o=...
- Edit this link to point to the port where the Ray Dashboard is exposed. Replace the Web Terminal port number with 9999, as defined in the script: https://…/driver-proxy/o/…/{cluster_id}/9999/
- Important: Make sure you include the trailing “/”
- On the Metrics tab, you should now see Ray metrics provided by Prometheus+Grafana!
Now you can submit any Ray application to this cluster. In a Databricks notebook, connect to the cluster, then use the following technique to initialize the Ray session:
import ray
import os
head_ip = os.getenv("SPARK_LOCAL_IP")
print(f"Using Ray Head node at: {head_ip}")

ray.init(address=f'ray://{head_ip}:10001')
Note that if you do not use the ray.init() technique above, you will not be connecting to the Ray global cluster provisioned in the init script. The script has been developed exclusively for the purpose of sharing a global Ray cluster script between one or many applications, but can be adapted for single-user Ray use-cases.
Additionally, with this process the Databricks cluster will never automatically terminate, even if you have selected autotermination settings in the Databricks UI. To avoid long-lived clusters, we recommend terminating the cluster when work is complete or setting up an automation to terminate all-purpose clusters at the end of the work period. As mentioned above, if you are using Spark and Ray together, review best practices for resource sharing and ensure sufficient resources are available for both processes, which might require utilizing both the Spark UI and Ray Dashboard.
Environment Compatibility
This script has been tested under the following conditions:
- Clouds: AWS Databricks, Azure Databricks
- Runtimes: 15.4 ML LTS, 16.1 ML
- This script may work on other Machine Learning runtimes with Ray pre-installed.
- Databricks Serverless compute does not allow init scripts.
- Cluster Access Mode: Dedicated
- Scaling: Single-node, Fixed-size multi-node, Autoscaling multi-node
Debugging
In the case of errors or failure for cluster to start:
- Review docs for enabling init script logs. Enable cluster logs for the cluster, then start the cluster again.
- Navigate to these logs and fix any errors from the …sh.stderr.log file
In the case that the cluster starts, but the Ray dashboard is not showing metrics properly:
- Go to the cluster → Apps → Web Terminal
- In the Terminal, execute the following commands to review log files from cluster setup.
- Python log for Ray cluster setup: cat /local_disk0/tmp/rayonsparkinit.log
- Prometheus setup log: cat /local_disk0/tmp/prometheus.log
- Grafana setup log: cat /local_disk0/tmp/grafana.log
- Fix any errors in the init script or cluster setup based on these logs
Resources
- [Github repo] Scientific Computing Ray on Spark
- [Ray docs] Ray Dashboard, metrics view
- [Ray docs] Embed Grafana visualizations into Ray Dashboard
- [Prometheus docs] Prometheus configuration
- [Grafana docs] Configure Grafana
- [Databricks docs] Init script logging
- [Databricks docs] Set and use environment variables with init scripts
- [Databricks docs] Compute access mode limitations for Unity Catalog
You must be a registered user to add a comment. If you've already registered, sign in. Otherwise, register and sign in.


Related Content
- 🌟 Community Pulse: Your Weekly Roundup! June 01 – 07, 2026 in Announcements
- ADF vs Databricks Workflows — When to Use Which in Community Articles
- # Retail demand forecasting on Databricks Free Edition in Community Articles
- Apache Spark’s Real-Time Mode Use Case Deep Dive: Gaming Sessionization in Technical Blog
- [CUSTOMER BLOG] Enabling Seamless Inbound Data Sharing at Magnite in Technical Blog