Turn on suggestions
Auto-suggest helps you quickly narrow down your search results by suggesting possible matches as you type.
Showing results for
Data Engineering
Turn on suggestions
Auto-suggest helps you quickly narrow down your search results by suggesting possible matches as you type.
Showing results for
- Databricks
- Data Engineering
- GC Driver Error
Options
- Subscribe to RSS Feed
- Mark Topic as New
- Mark Topic as Read
- Float this Topic for Current User
- Bookmark
- Subscribe
- Mute
- Printer Friendly Page
GC Driver Error
Options
- Mark as New
- Bookmark
- Subscribe
- Mute
- Subscribe to RSS Feed
- Permalink
- Report Inappropriate Content
09-23-2022 12:43 PM
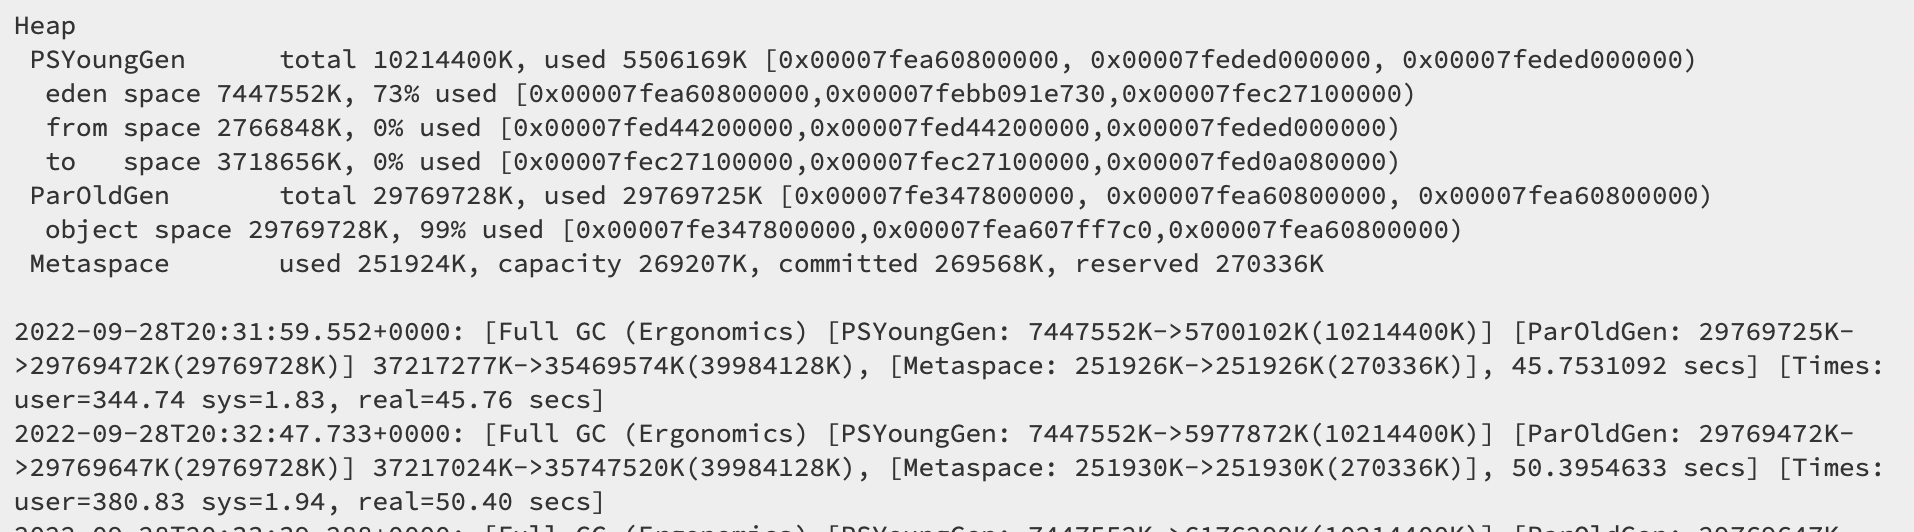
I am using a cluster in databricks to connect to a Tableau workbook through the JDBC connector. My Tableau workbook has been unable to load due to resources not being available through the data connection. I went to look at the driver log for my cluster and I see Full GC (Ergonomics) errors and Full GC Allocation errors. How do I resolve this? I've tried increasing the storage of my driver and worker by changing them in my cluster but that didn't fix it.
Labels:
32 REPLIES 32
Options
- Mark as New
- Bookmark
- Subscribe
- Mute
- Subscribe to RSS Feed
- Permalink
- Report Inappropriate Content
09-26-2022 02:14 PM
Well you should be using the Databricks ODBC connector and not a JDBC connector for Tableau. Let me know when you make that switch if that error keeps happening.
Options
- Mark as New
- Bookmark
- Subscribe
- Mute
- Subscribe to RSS Feed
- Permalink
- Report Inappropriate Content
09-27-2022 09:41 AM
I downloaded the ODBC connector from here: https://www.databricks.com/spark/odbc-drivers-download?_ga=2.75890453.1274928885.1664211300-13887178... . Now how do I use this with my cluster? I was connecting to the cluster from Tableau through the server host name and HTTP path already to the JDBC so I am just wondering how I connect to the ODBC instead of the JDBC.
Options
- Mark as New
- Bookmark
- Subscribe
- Mute
- Subscribe to RSS Feed
- Permalink
- Report Inappropriate Content
09-27-2022 01:05 PM
I now also downloaded an ODBC manager and tried creating a User DSN in it but am not too sure where these helpers are going or how to use them. I am following the steps given here: https://docs.databricks.com/integrations/bi/jdbc-odbc-bi.html#odbc-driver-guide .
Options
- Mark as New
- Bookmark
- Subscribe
- Mute
- Subscribe to RSS Feed
- Permalink
- Report Inappropriate Content
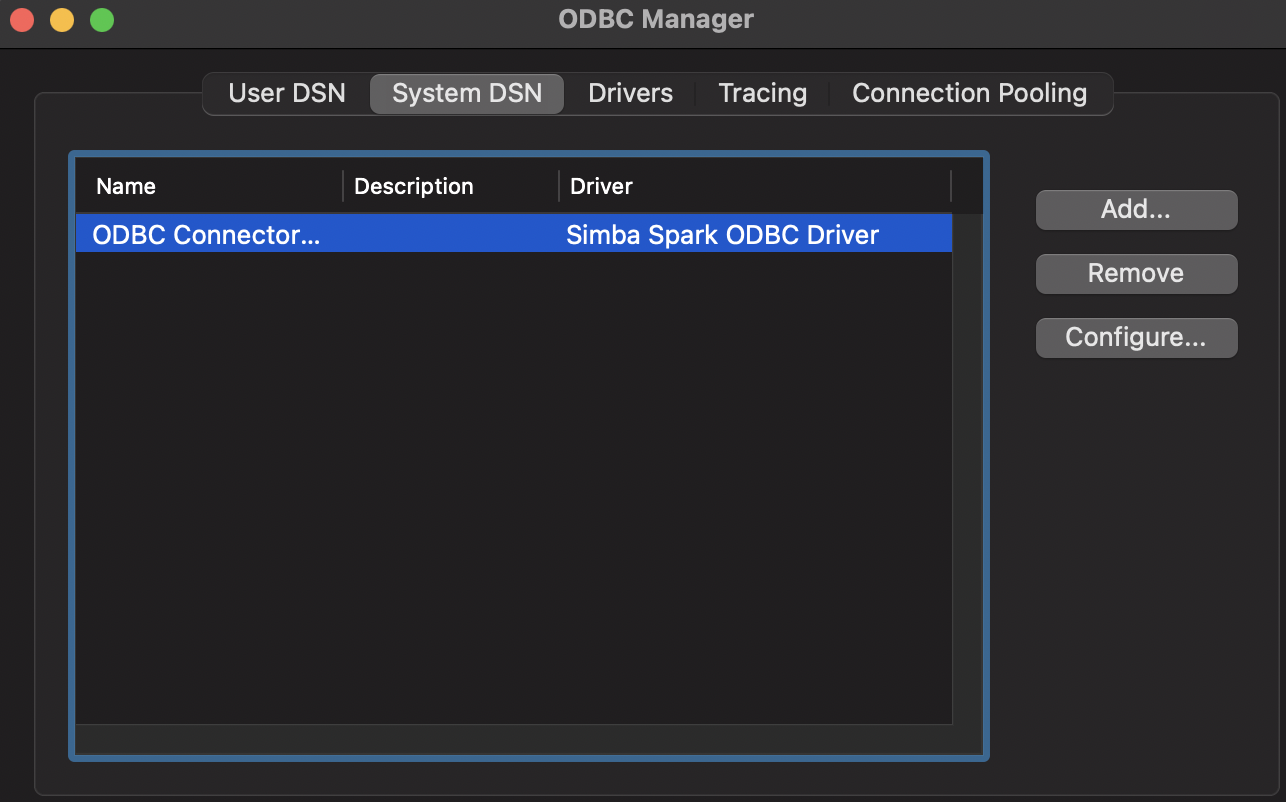
09-27-2022 01:28 PM
Sorry for the constant updates, but I have successfully created an ODBC connector using the Simba Spark Driver. It has my databricks cluster host name, http path, port number and, for authentication, my databricks login info. Now that this is established, how do I get Tableau Online (not Tableau Desktop) to connect using this ODBC stuff and not the JDBC stuff causing the garbage collection error.

Options
- Mark as New
- Bookmark
- Subscribe
- Mute
- Subscribe to RSS Feed
- Permalink
- Report Inappropriate Content
09-27-2022 02:26 PM
You are going to publish workbooks from Tableau Desktop to Tableau Online. These are the instructions.
Options
- Mark as New
- Bookmark
- Subscribe
- Mute
- Subscribe to RSS Feed
- Permalink
- Report Inappropriate Content
09-27-2022 02:34 PM
I don't have Tableau Desktop, I only have access to Tableau Online.
Options
- Mark as New
- Bookmark
- Subscribe
- Mute
- Subscribe to RSS Feed
- Permalink
- Report Inappropriate Content
09-28-2022 12:32 PM
Okay, what is your cluster configuration? Did you try a bigger cluster and had the same problem? When you ran the connector, did you look at your metrics for your cluster to see the memory usage? What do you see? Also are you using the spot or on demand cluster? What DRT version are you using? Are you using a Unity Catalog enabled cluster?
Options
- Mark as New
- Bookmark
- Subscribe
- Mute
- Subscribe to RSS Feed
- Permalink
- Report Inappropriate Content
09-28-2022 12:49 PM
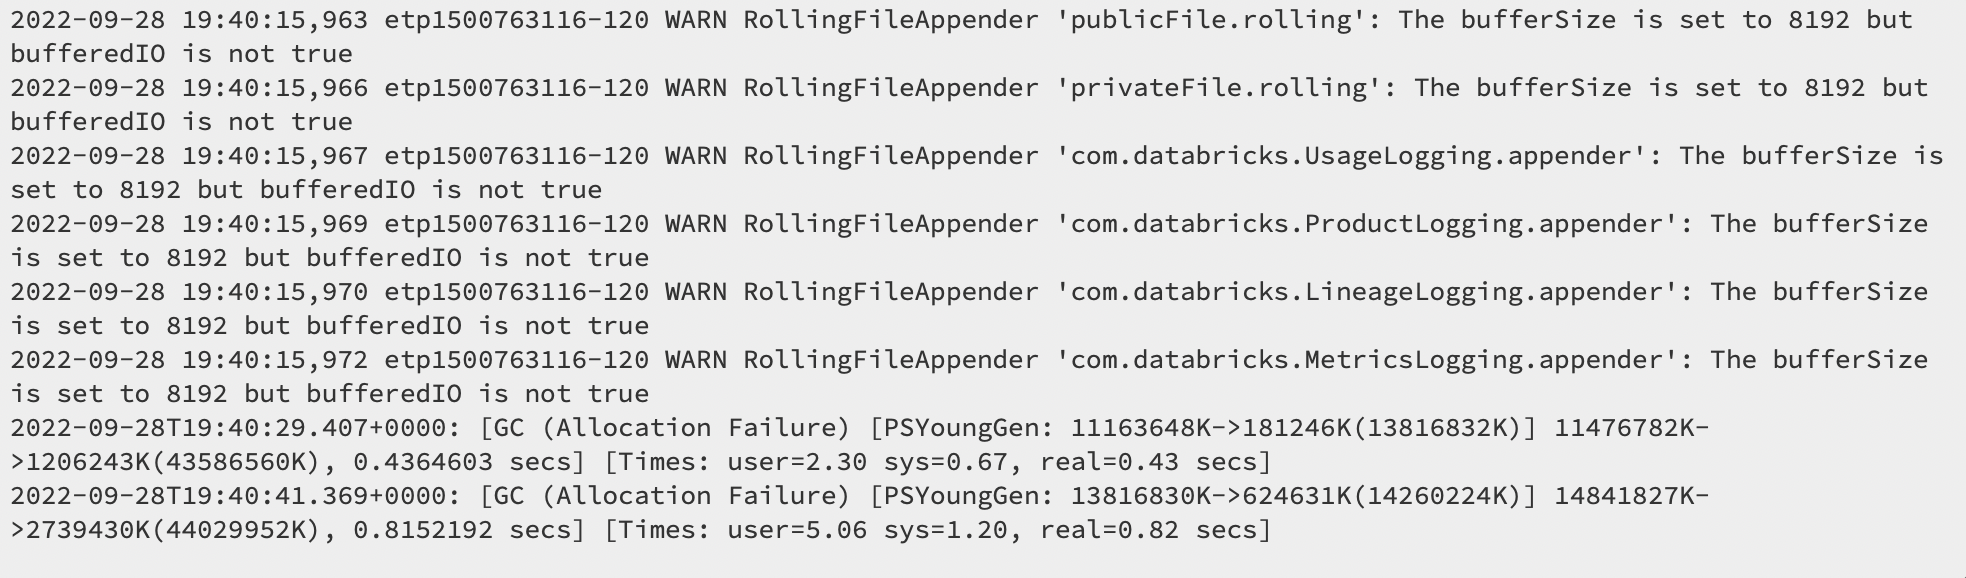
I am using a i3.xlarge worker and i3.2xlarge driver cluster. I have played around with the larger memory sizes of the cluster and still get the same issue. I don't know how to use to ODBC connector but when I was connecting before (I guess to the JDBC) using the server host name and http path in tableau, I get errors like in the picture in my cluster's driver log. 
Options
- Mark as New
- Bookmark
- Subscribe
- Mute
- Subscribe to RSS Feed
- Permalink
- Report Inappropriate Content
09-28-2022 01:36 PM

Options
- Mark as New
- Bookmark
- Subscribe
- Mute
- Subscribe to RSS Feed
- Permalink
- Report Inappropriate Content
09-29-2022 05:49 PM
One thing I would try is to have more workers with memory-optimized instances with larger memories to see if that will fixed it. I know you played with it a bit, but maybe with more workers & larger memory that might fix this. But let's take a look at the Spark UI a bit to try to troubleshoot.
(1) Under Stages of the job that ran that created the error - under the summary metrics, do you see data spill? If you do not see it there then you can see data spill in the SQL tab where you find the SQL query associated to the job number with the error and then you can click the query to see the DAG. You can click the + in the boxes to see the write out and see if you see a data spill in there.
(2) You go to Spark UI and then go to JDBC/ODBC connector, do you see data leaving?
(3) Also under stages, can you take a screenshot of what you see for this job? Can you sort by shuffle read?
(4) Do you see anything cached in storage under the "Storage" tab?
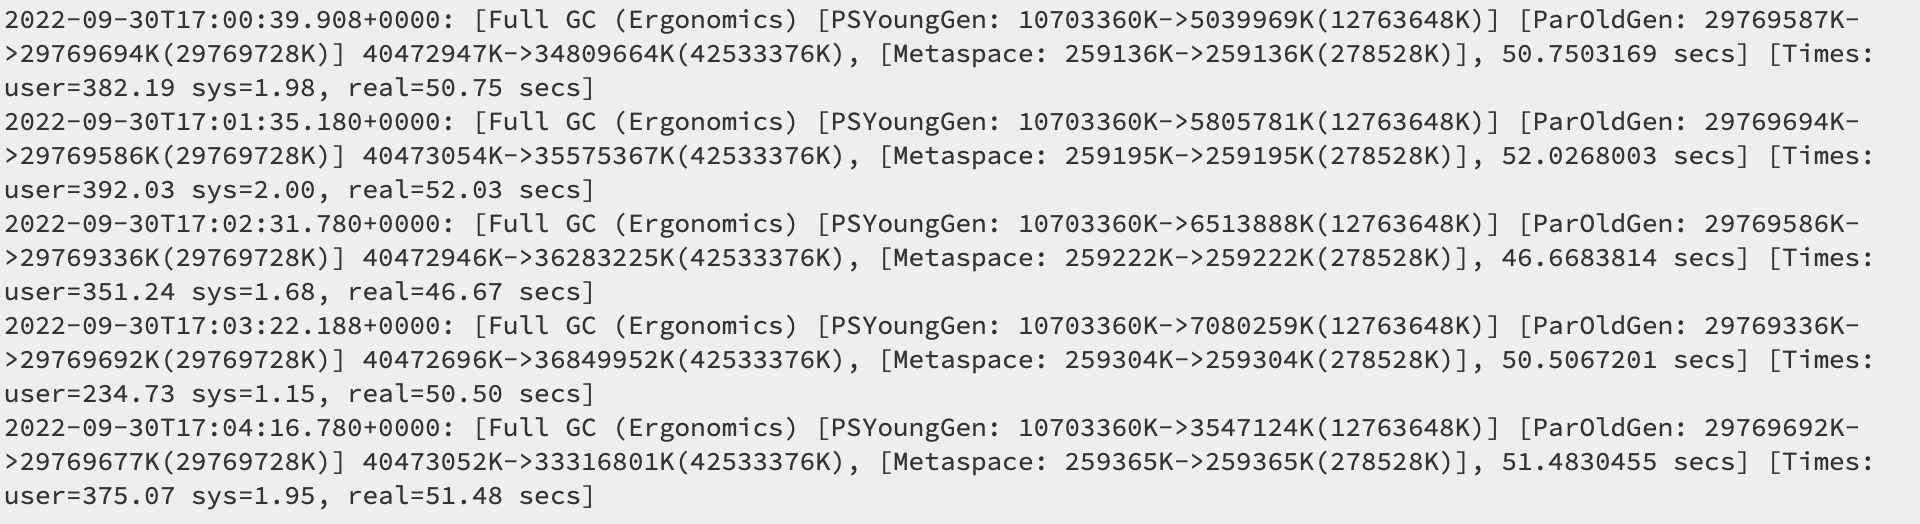
So there is a reference to PSYoungGen, I believe it didn't have enough to allocate memory for possible a large object and thus a GC was triggered by allocation failure. Did this happen multiple times in a 10s interval?
Options
- Mark as New
- Bookmark
- Subscribe
- Mute
- Subscribe to RSS Feed
- Permalink
- Report Inappropriate Content
09-30-2022 09:44 AM
I increased the minimum amount of worker out of 8 from 2 to 7.
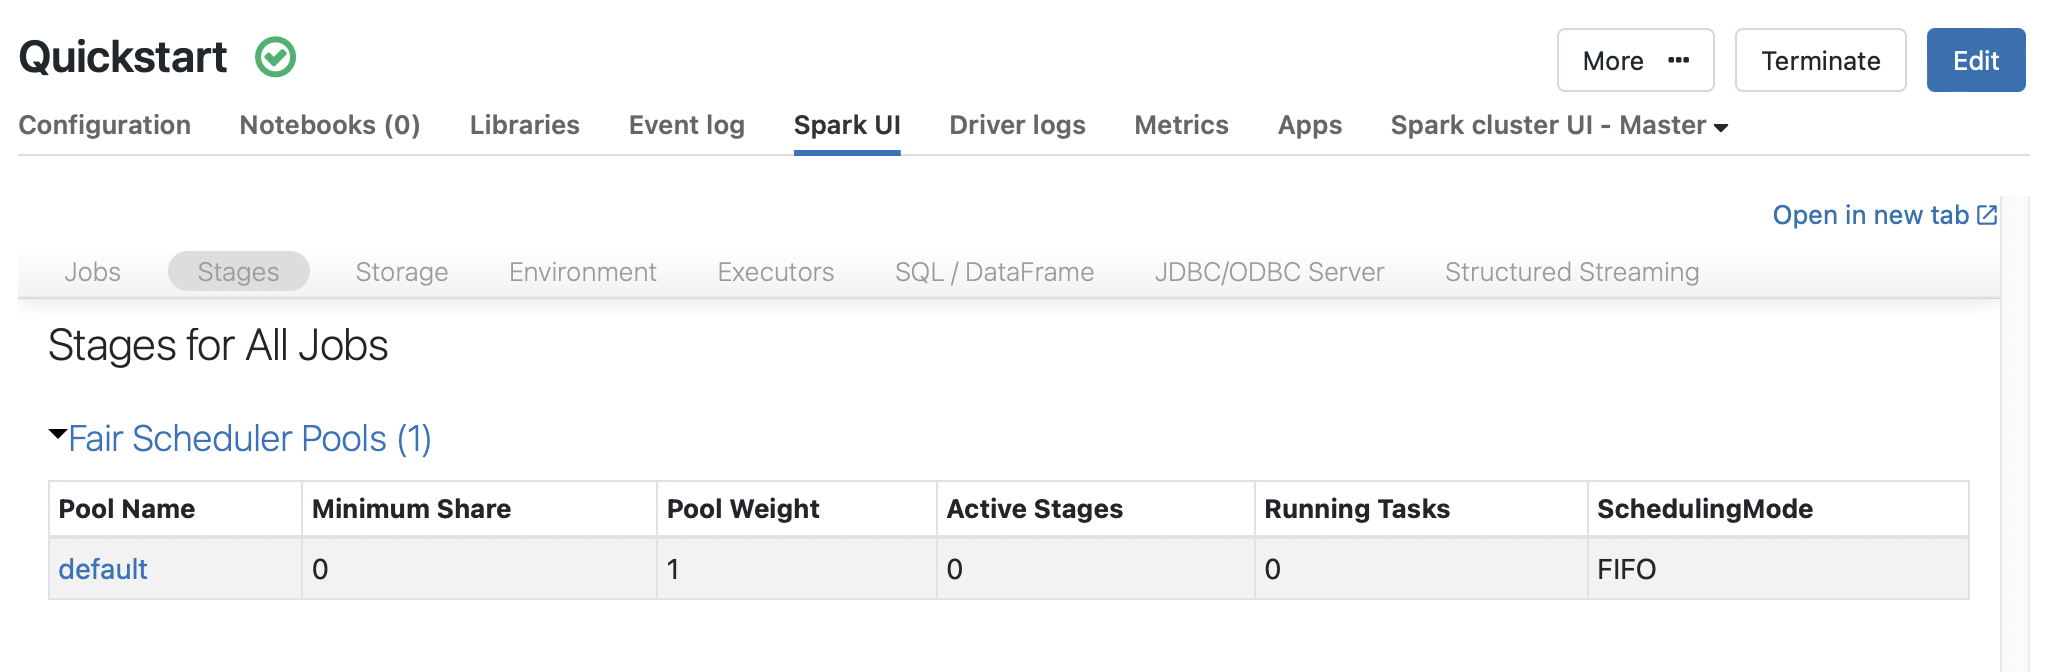
(1) I see this under Stages in Spark UI, doesn't look to show a data spill. 

This is as far as I got for now before the Spark UI tab itself is just blank and not loading anything.

Options
- Mark as New
- Bookmark
- Subscribe
- Mute
- Subscribe to RSS Feed
- Permalink
- Report Inappropriate Content
09-30-2022 10:13 AM
Once restarting the cluster I started to see the information:
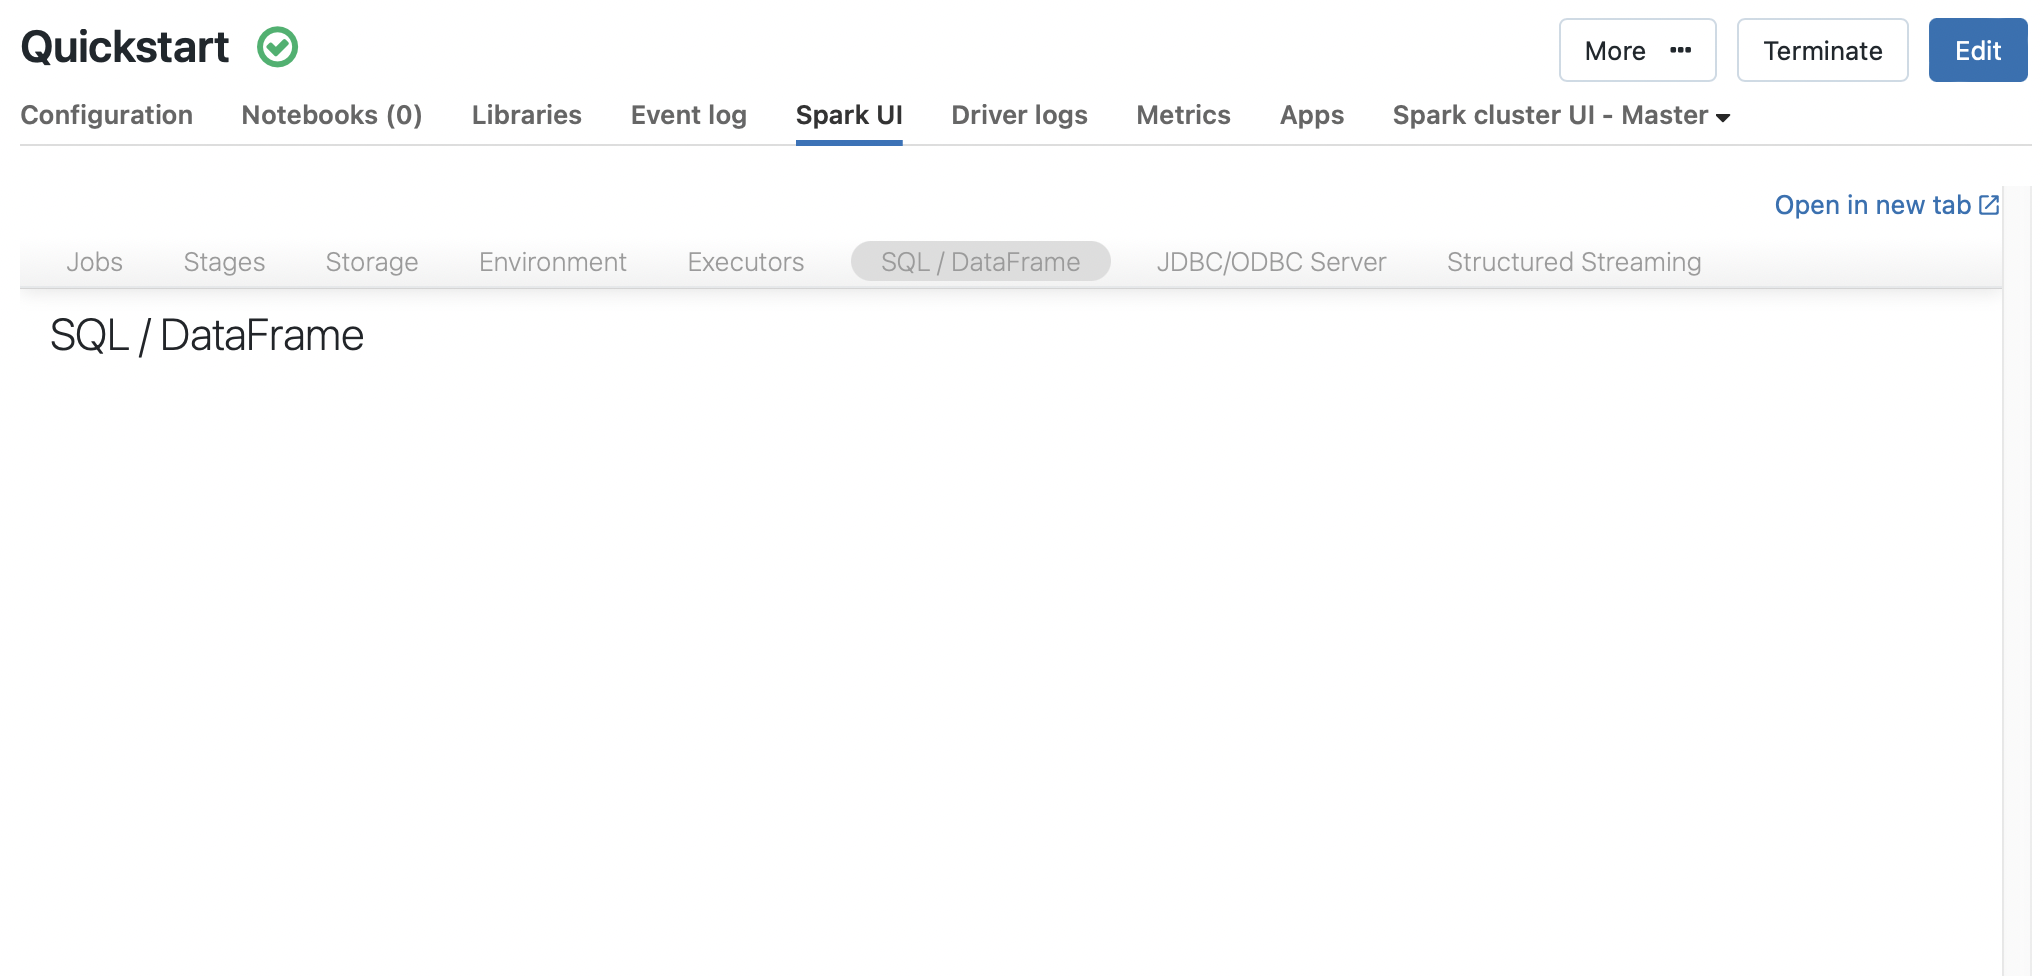
(1) Attached are what I see in the Stages and SQL tab. Doesn't look like any data spill.
(2) How would I see data leaving? I just see session statistics and SQL statistics:

(3) I also attached an image (in a word doc because it was too big to paste here) of what I see under Stages tab sorted by Shuffle Read
(4) Here is what is cached under Storage tab
And here is an image of the PSYoungGen errors where there are multiple "Times" for each error. sys (system) says 2 seconds, then real says about 50 seconds. This is a lot to understand and look at so forgive me if I am not providing you with the correct information.

Options
- Mark as New
- Bookmark
- Subscribe
- Mute
- Subscribe to RSS Feed
- Permalink
- Report Inappropriate Content
09-30-2022 10:13 AM
Options
- Mark as New
- Bookmark
- Subscribe
- Mute
- Subscribe to RSS Feed
- Permalink
- Report Inappropriate Content
09-30-2022 10:13 AM
Announcements


Welcome to Databricks Community: Lets learn, network and celebrate together
Join our fast-growing data practitioner and expert community of 80K+ members, ready to discover, help and collaborate together while making meaningful connections.
Click here to register and join today!
Engage in exciting technical discussions, join a group with your peers and meet our Featured Members.
Related Content
- while registering model I am getting error: AssertionError: in Machine Learning
- An error occurred when loading Jobs and Workflows App. in Data Engineering
- Workflow UI broken after creating job via the api in Data Engineering
- Error during deserializing protobuf data in Data Engineering
- SparkContext lost when running %sh script.py in Data Engineering