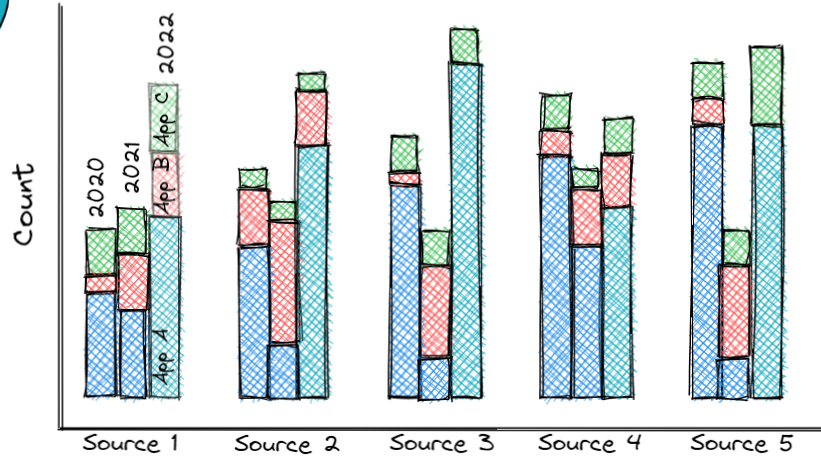
I wish to create a visualization combined of grouped bars, and also have those bars stacked.
Attached is a sketch of the final result I am interested in.
I am also attaching my sql because I'm not sure if I should "group by" in the query or in the visualization parameters.

select SUM(case when partition_date= '2022-11-16' then 1 else 0 end) as uploads_2022_11_16,
SUM(case when partition_date= '2022-11-17' then 1 else 0 end) as uploads_2022_11_17,
SUM(case when partition_date= '2022-11-18' then 1 else 0 end) as uploads_2022_11_18,
sourceType, entryApplication
from ovp_raw.entry_lifecycle
where partition_date > '2022-11-15'
group by sourceType, entryApplication
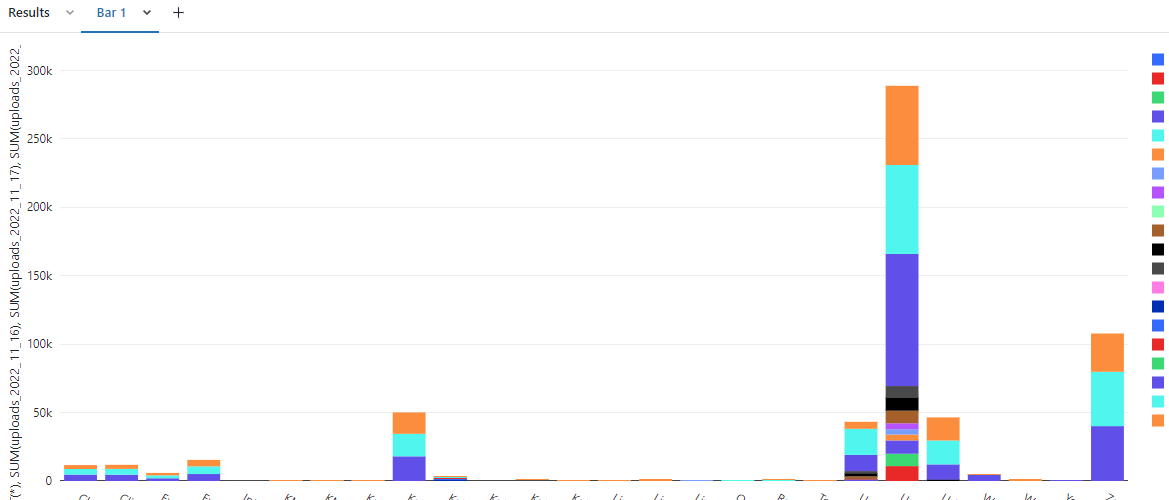
now it is just all stacked


