Turn on suggestions
Auto-suggest helps you quickly narrow down your search results by suggesting possible matches as you type.
Showing results for
Data Engineering
Join discussions on data engineering best practices, architectures, and optimization strategies within the Databricks Community. Exchange insights and solutions with fellow data engineers.
Turn on suggestions
Auto-suggest helps you quickly narrow down your search results by suggesting possible matches as you type.
Showing results for
- Databricks Community
- Data Engineering
- Question about monitoring driver memory utilizatio...
Options
- Subscribe to RSS Feed
- Mark Topic as New
- Mark Topic as Read
- Float this Topic for Current User
- Bookmark
- Subscribe
- Mute
- Printer Friendly Page
Question about monitoring driver memory utilization
Options
- Mark as New
- Bookmark
- Subscribe
- Mute
- Subscribe to RSS Feed
- Permalink
- Report Inappropriate Content
06-21-2023 06:25 AM
Hi databricks/spark experts!
I have a piece on pandas-based 3rd party code that I need to execute as a part of a bigger spark pipeline. By nature, pandas-based code is executed on driver node. I ran into out of memory problems and started exploring the topic of monitoring driver node memory utilization.
My questions are:
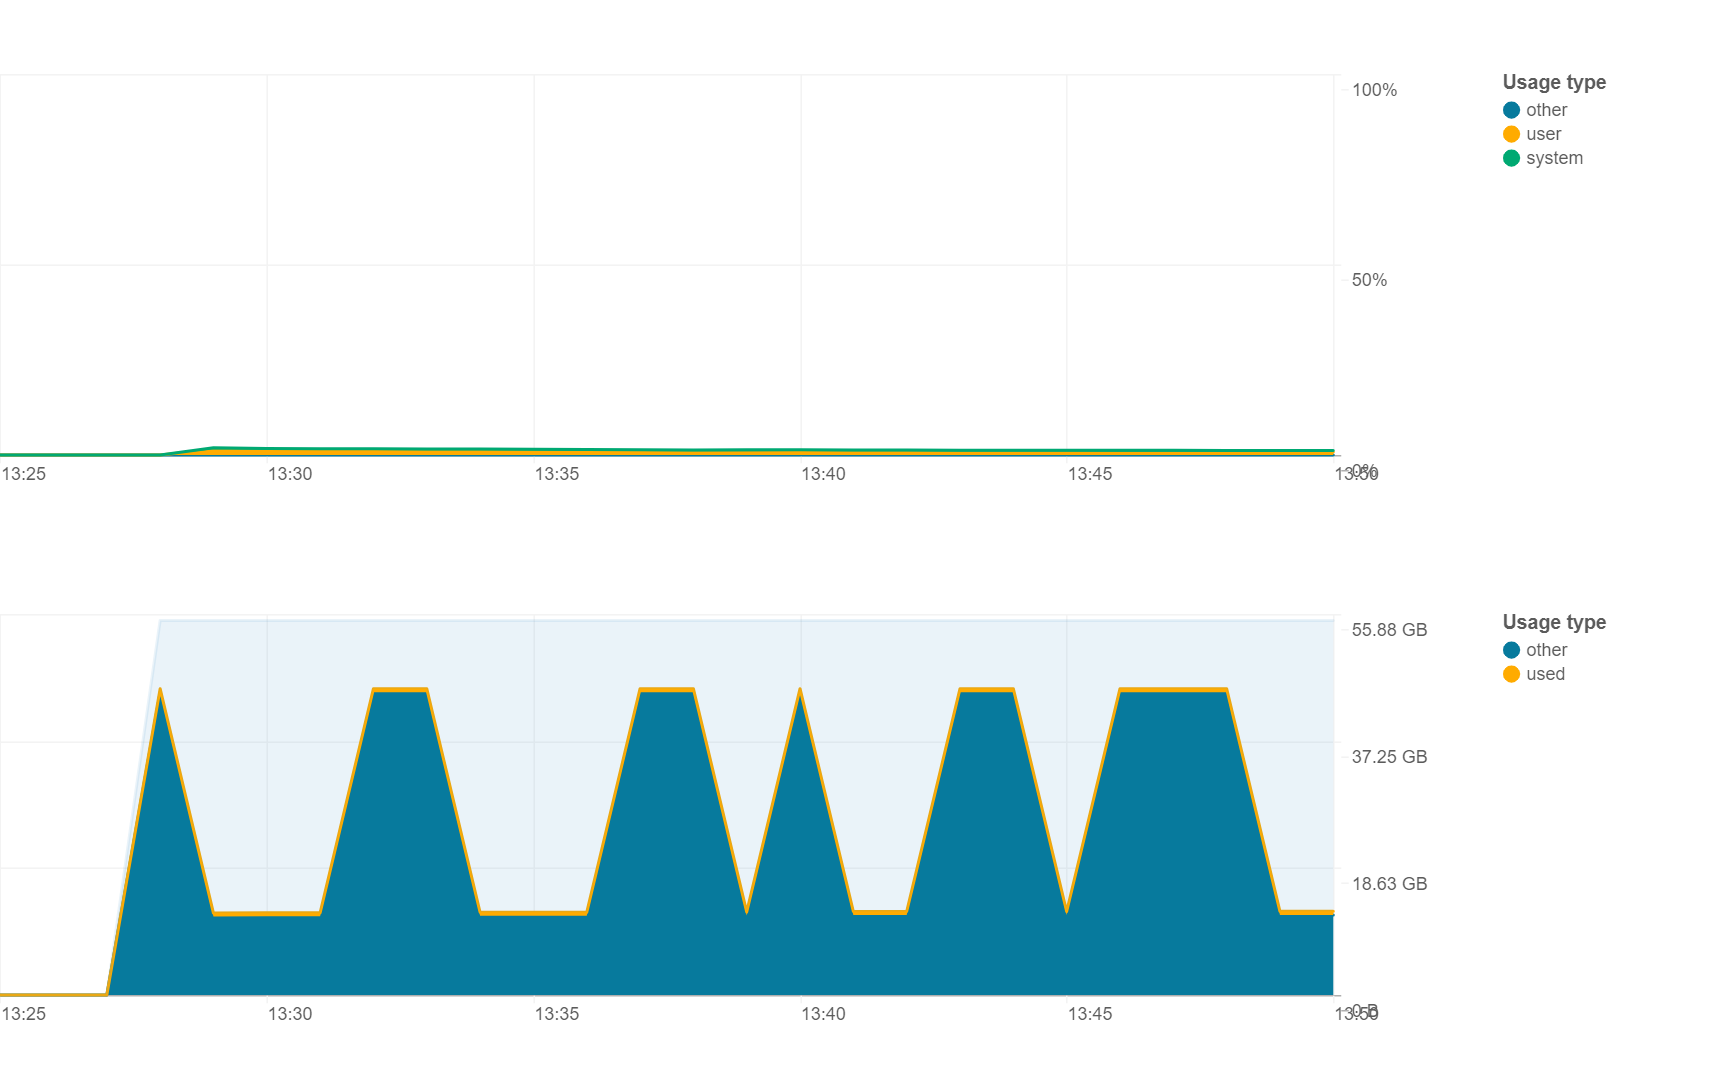
1) I have an idle cluster with 56Gb of RAM, and when looking at new "Metrics" I see weird memory fluctuations/cycles. Where do these cycles come from? The cluster is not running any code (CPU util ~0%) so I am wondering what's going on? 

3) How does spark.driver.memory setting affects all that? Accrding to spark docs, by default it is 1g. Is this the max amount of memory that I can use when running my code ("used" series)? 1g seems extremally low. Would it make sense to increase it to 8 or 16g for my scenario?
Thx!


7 REPLIES 7
Anonymous
Not applicable
Options
- Mark as New
- Bookmark
- Subscribe
- Mute
- Subscribe to RSS Feed
- Permalink
- Report Inappropriate Content
06-21-2023 10:19 PM
Hi @Wojciech Jakubowski
Great to meet you, and thanks for your question!
Let's see if your peers in the community have an answer to your question. Thanks.
Options
- Mark as New
- Bookmark
- Subscribe
- Mute
- Subscribe to RSS Feed
- Permalink
- Report Inappropriate Content
08-14-2023 02:52 PM
You can always reconfigure that and set it to higher size.
spark.driver.maxResultSize 4g --this will allocate 4GB of driver memory
Options
- Mark as New
- Bookmark
- Subscribe
- Mute
- Subscribe to RSS Feed
- Permalink
- Report Inappropriate Content
08-14-2023 10:36 PM
About the first question, driver memory utilization is high and we could see multiple cycles of high utlization. The primary reason behind this is, even if a cluster is idle, driver has to perform multiple operations to keep the cluster active and ready for processing. Some of the activities are
- heart beat messages
- gc
- listening for job requests
- hosting spark ui
- monitoring resources
This happens in intervals and this is the reason behind memory utilization happening in cycles on the driver.
Options
- Mark as New
- Bookmark
- Subscribe
- Mute
- Subscribe to RSS Feed
- Permalink
- Report Inappropriate Content
08-16-2023 05:00 AM
Hi Tharun-Kumar.
Thanks for your answer. I get that all these activities you listed are required for cluster to function correctly. But 40 gigs of ram for that? That looks way too much imo... especially that all these activates are also done on much smaller drivers that have 8 or 16 gigs of RAM...
Options
- Mark as New
- Bookmark
- Subscribe
- Mute
- Subscribe to RSS Feed
- Permalink
- Report Inappropriate Content
08-14-2023 10:46 PM
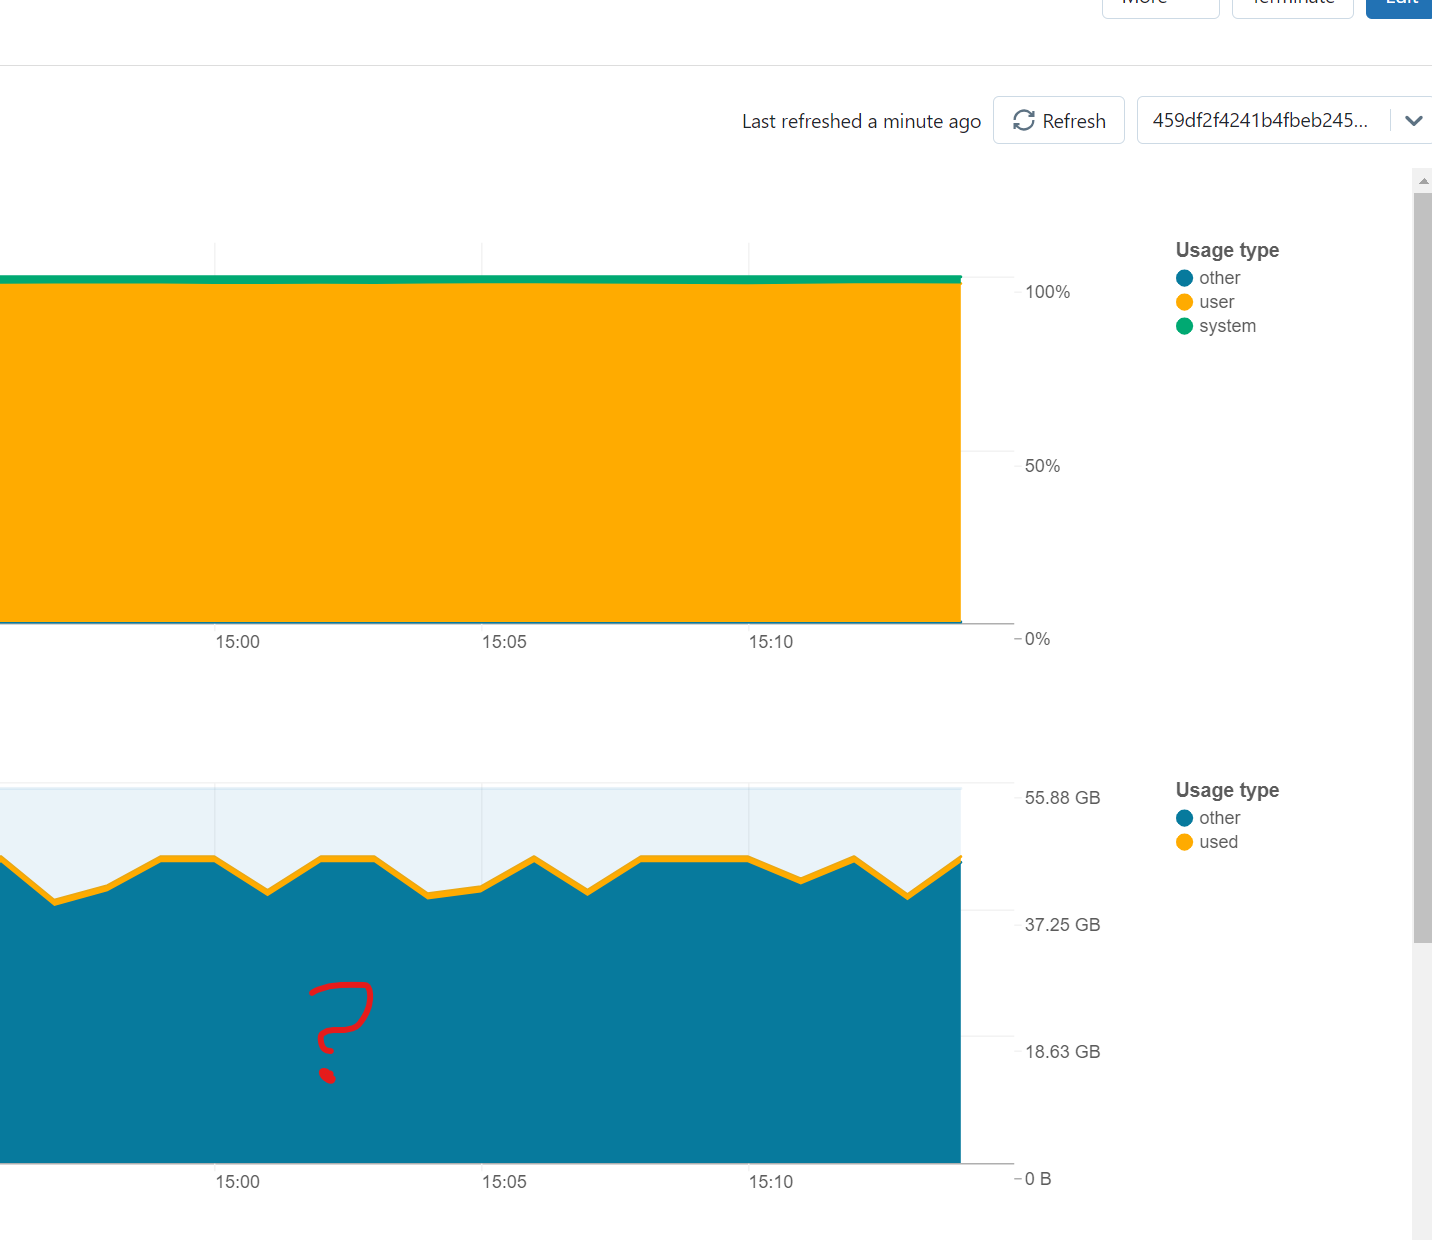
About your third question, you can get to know the actual value of spark.driver.memory by looking at the executors tab in spark UI. This will also have the driver and we can get to know the actual value of the driver memory.
In the spark UI, we would be able to see only the storage memory. Execution memory will almost be equal to the storage memory.

In this case, driver memory would be 21.4GB. This will be the amount of memory allocated to JVM related activities.
Options
- Mark as New
- Bookmark
- Subscribe
- Mute
- Subscribe to RSS Feed
- Permalink
- Report Inappropriate Content
08-16-2023 05:03 AM
Hi,
How did you infer from this image that driver memory would be 21.4 GB? Shouldn't it be 10.4 GB?
Also, if a memory is allocated to JVM related activities, can this memory can be also utilized from python? Meaning if I have 21.4 gb for JVM, does it mean I can use all that memory from python (for instance to load some crazdy pandas dataframes)?
Options
- Mark as New
- Bookmark
- Subscribe
- Mute
- Subscribe to RSS Feed
- Permalink
- Report Inappropriate Content
08-16-2023 12:59 PM
1. JVM memory will not be utilized for python related activities.
2. In the image we could only see the storage memory. We also have execution memory which would also be the same. Hence I came up with the executor memory to be of size 21.4GB
Announcements


Related Content
- Is Databricks AI/BI Genie worth it if we already have Power BI or Tableau? in Data Engineering
- Best option for parallel processing in Data Engineering
- Looking for Suggestions: Designed a Decision Tree to Recommend Optimal VM Types for Workloads in Data Engineering
- tagging for serverless compute in Data Governance
- Azure Databricks Classic Compute Plane Firewall in Administration & Architecture