Turn on suggestions
Auto-suggest helps you quickly narrow down your search results by suggesting possible matches as you type.
Showing results for
Data Engineering
Join discussions on data engineering best practices, architectures, and optimization strategies within the Databricks Community. Exchange insights and solutions with fellow data engineers.
Turn on suggestions
Auto-suggest helps you quickly narrow down your search results by suggesting possible matches as you type.
Showing results for
- Databricks Community
- Data Engineering
- Why is Delta Lake creating a 238.0TiB shuffle on m...
Options
- Subscribe to RSS Feed
- Mark Topic as New
- Mark Topic as Read
- Float this Topic for Current User
- Bookmark
- Subscribe
- Mute
- Printer Friendly Page
Why is Delta Lake creating a 238.0TiB shuffle on merge?
Options
- Mark as New
- Bookmark
- Subscribe
- Mute
- Subscribe to RSS Feed
- Permalink
- Report Inappropriate Content
02-24-2023 08:28 AM
I'm frankly at a loss here. I have a task that is consistently performing just awfully. I took some time this morning to try and debug it and the physical plan is showing a 238TiB shuffle:
== Physical Plan ==
AdaptiveSparkPlan (40)
+- == Current Plan ==
   SerializeFromObject (22)
   +- MapPartitions (21)
      +- DeserializeToObject (20)
         +- Project (19)
            +- ObjectHashAggregate (18)
               +- Exchange (17)
                  +- ObjectHashAggregate (16)
                     +- ObjectHashAggregate (15)
                        +- ShuffleQueryStage (14), Statistics(sizeInBytes=238.0 TiB)
                           +- Exchange (13)
                              +- ObjectHashAggregate (12)
                                 +- * Project (11)
                                    +- CartesianProduct Inner (10)
                                       :- * Project (5)
                                       :  +- * Filter (4)
                                       :     +- * Project (3)
                                       :        +- * ColumnarToRow (2)
                                       :           +- Scan parquet  (1)
                                       +- * Project (9)
                                          +- * Project (8)
                                             +- * ColumnarToRow (7)
                                                +- Scan parquet  (6)
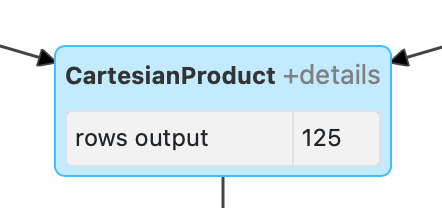
I could understand this number if I was working with a lot of data. I'm not. The Cartesian Product in this query produces 125 rows as shown below so it's not my merge logic

I feel like I'm at the end of my wits with this problem. Any ideas would be appreciated.
Labels:
- Labels:
-
Delt Lake
-
MERGE Performance
8 REPLIES 8
Anonymous
Not applicable
Options
- Mark as New
- Bookmark
- Subscribe
- Mute
- Subscribe to RSS Feed
- Permalink
- Report Inappropriate Content
02-24-2023 10:48 AM
So I'm not too sure of the problem, but I'll walk you through my thinking and ideas.
The deserialize/map/serialize is that a case class in Scala?
How big are the two tables you're joining?
Options
- Mark as New
- Bookmark
- Subscribe
- Mute
- Subscribe to RSS Feed
- Permalink
- Report Inappropriate Content
02-24-2023 10:50 AM
@Joseph Kambourakis one table is 1.5MB. The other is about 80MB.
Options
- Mark as New
- Bookmark
- Subscribe
- Mute
- Subscribe to RSS Feed
- Permalink
- Report Inappropriate Content
02-24-2023 10:54 AM
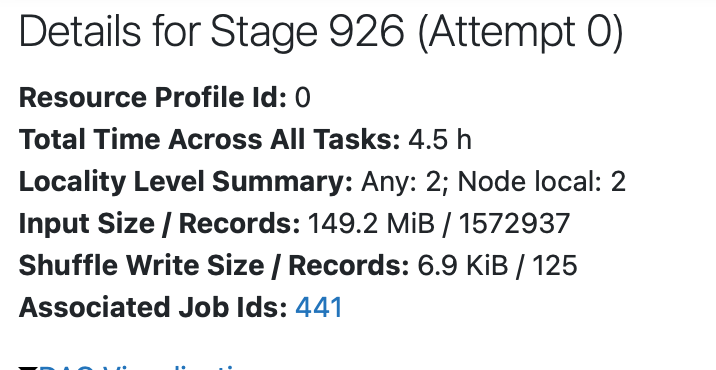
Hmm, then it doesn't make sense that it would create much data on a shuffle or in any capacity. What does the shuffle look like in the plan? It should say data written/read in that part.
Options
- Mark as New
- Bookmark
- Subscribe
- Mute
- Subscribe to RSS Feed
- Permalink
- Report Inappropriate Content
02-24-2023 10:58 AM
Options
- Mark as New
- Bookmark
- Subscribe
- Mute
- Subscribe to RSS Feed
- Permalink
- Report Inappropriate Content
02-24-2023 11:00 AM
The input size and records looks like what you'd expect from the table sizes and it's not creating 218TB thankfully. That said, I'm not exactly sure what the problem is in that stage, but there is def something going on w/ that length of time.
Options
- Mark as New
- Bookmark
- Subscribe
- Mute
- Subscribe to RSS Feed
- Permalink
- Report Inappropriate Content
02-24-2023 11:02 AM
I'm honestly wondering if it's just not a trick of the logic on the merge at this point.
I tried running a join between the output files and what would be the input to my MERGE statement. I ran an explain on that query and it ends up creating a BroadcastNestedLoopJoin. More times than not, nested loop joins have bedeviled my performance. I'm going to just try splitting the merge in to two separate calls and see if that does the trick for me.
It might just be that the explain on a MERGE doesn't show this because of how merges are executed.
Options
- Mark as New
- Bookmark
- Subscribe
- Mute
- Subscribe to RSS Feed
- Permalink
- Report Inappropriate Content
04-25-2023 04:01 AM
Hi @Jordan Yaker,
Hope all is well!
Just wanted to check in if you were able to resolve your issue and would you be happy to share the solution or mark an answer as best? Else please let us know if you need more help.
We'd love to hear from you.
Thanks!
Options
- Mark as New
- Bookmark
- Subscribe
- Mute
- Subscribe to RSS Feed
- Permalink
- Report Inappropriate Content
04-25-2023 11:42 AM
It turned out to be the BroadcastNestedLoopJoin. Once I reworked my logic to remove that, the performance cleared up.
Announcements
Related Content
- Auto Loader with ignoreMissingFiles and useManagedFileEvents fails on Classic Compute in Data Engineering
- Cannot create streaming table in Data Engineering
- Error creating Git folder: Invalid Git provider credential although PAT is valid in Administration & Architecture
- Metric views joins in Data Engineering
- Lakebase in an enterprise setup in Administration & Architecture


