Turn on suggestions
Auto-suggest helps you quickly narrow down your search results by suggesting possible matches as you type.
Showing results for
Machine Learning
Dive into the world of machine learning on the Databricks platform. Explore discussions on algorithms, model training, deployment, and more. Connect with ML enthusiasts and experts.
Turn on suggestions
Auto-suggest helps you quickly narrow down your search results by suggesting possible matches as you type.
Showing results for
- Databricks Community
- Machine Learning
- Re: Endpoint performance questions
Options
- Subscribe to RSS Feed
- Mark Topic as New
- Mark Topic as Read
- Float this Topic for Current User
- Bookmark
- Subscribe
- Mute
- Printer Friendly Page
Options
- Mark as New
- Bookmark
- Subscribe
- Mute
- Subscribe to RSS Feed
- Permalink
- Report Inappropriate Content
03-11-2024 03:42 PM - edited 03-11-2024 03:47 PM
Hi!
Had really interesting results from some endpoint performance tests I did. I set up the non-optimized endpoint with zero-cluster scaling and optimized had this feature disabled.
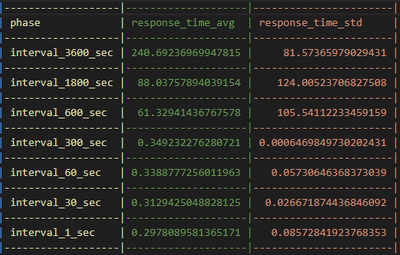
1) Why does the non-optimized endpoint have variable response time for 3600, 1800, and 600 seconds tests? If the serving cluster node scaled to 0 (due to no traffic) I would expect it to also require 240 seconds to start up and start serving again.
- what is going on behind the scenes that results in this?
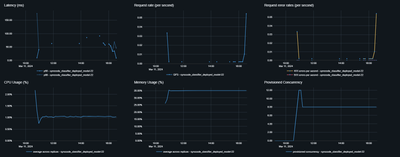
2) It was also interesting to see that the endpoint metrcs showed request error rates (top right graph). The endpoint didnt have any bad responses. Also the logs didnt show anything that would allude to this. Any idea why this would be the case? See blow for the metrics image.
3) I didnt find much information on this on the databricks documentation. Any additional documentation would be appreicated! Happy to sync with the team
non-optimized endpoint results
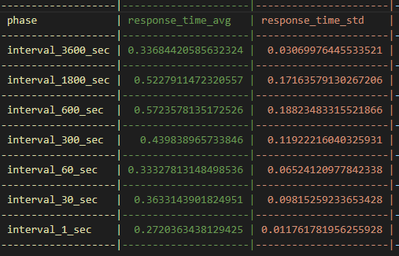
optimized endpoint results
metrics log:
1 ACCEPTED SOLUTION
Accepted Solutions
Options
- Mark as New
- Bookmark
- Subscribe
- Mute
- Subscribe to RSS Feed
- Permalink
- Report Inappropriate Content
04-09-2024 09:52 AM
Independently found the solution to item 2. Currently you cannot modify the 30 min time for scale to zero.
Hope this helps someone in the future!
5 REPLIES 5
Options
- Mark as New
- Bookmark
- Subscribe
- Mute
- Subscribe to RSS Feed
- Permalink
- Report Inappropriate Content
03-11-2024 03:45 PM
Options
- Mark as New
- Bookmark
- Subscribe
- Mute
- Subscribe to RSS Feed
- Permalink
- Report Inappropriate Content
03-11-2024 03:55 PM
Answering Q1:
1) The variable response time is due to the first endpoint response time requiring ~180 seconds to scale to 1 cluster from 0
2) Can i change zero scale time from the preset 30 min?
Options
- Mark as New
- Bookmark
- Subscribe
- Mute
- Subscribe to RSS Feed
- Permalink
- Report Inappropriate Content
03-12-2024 08:19 AM
Thanks for this.
1) The odd values i got for 3600/1800/ etc was due to an outlier in my data so in general a response time of ~183 sec should be expected
2) @Retired_mod can we adjust the scaling of the cluster from 30 min to something else?
Options
- Mark as New
- Bookmark
- Subscribe
- Mute
- Subscribe to RSS Feed
- Permalink
- Report Inappropriate Content
03-14-2024 10:16 AM
Options
- Mark as New
- Bookmark
- Subscribe
- Mute
- Subscribe to RSS Feed
- Permalink
- Report Inappropriate Content
04-09-2024 09:52 AM
Independently found the solution to item 2. Currently you cannot modify the 30 min time for scale to zero.
Hope this helps someone in the future!
Announcements
Related Content
- Stop Refreshing. Start Querying. in Data Engineering
- Questions on Auto Loader auto Listing Logic in Data Engineering
- Newly added workspace users do not appear immediately in WorkspaceClient().users.list() or SCIM API in Administration & Architecture
- Databricks Model Serving Scaling Logic in Machine Learning
- Unable to connect Claude connector to Databricks MCP server (Genie) in Administration & Architecture


