cancel
Showing results forย 
Search instead forย 
Did you mean:ย 
Warehousing & Analytics
Engage in discussions on data warehousing, analytics, and BI solutions within the Databricks Community. Share insights, tips, and best practices for leveraging data for informed decision-making.
cancel
Showing results forย 
Search instead forย 
Did you mean:ย 

Visual Data Prep - Missing rows when loading tables

dax60
Visitor

Hi,

I'm experiencing an issue with Visual Data Prep where some source tables appear to contain fewer rows than expected.

When I query the same tables directly using SQL, I can see all records. However, when loading certain tables into Visual Data Prep through a Source operator, the row count appears to be much lower.

What makes this confusing is that the issue only happens for some tables.

For other tables, when I set Rows scanned = Max, all rows appear to be available as expected.

For the affected tables, the lower row count is already visible immediately after the Source step, before I perform any joins, filters, or transformations.

โ€ƒ

I've included two screenshots:

  1. A SQL count showing the table contains 4,168 rows.
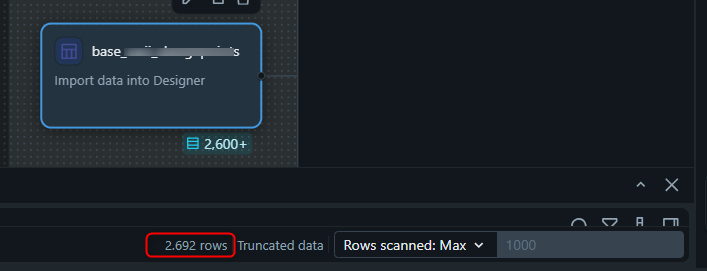
  2. The same table loaded into Visual Data Prep, where the Source operator only shows approximately 2,692 rows.

This difference is visible before any transformations are applied.

My questions are:

  • Does Visual Data Prep automatically sample data for certain tables?
  • Can "Truncated data" affect the displayed row count?
  • Is there any known limitation that would cause some source tables to show fewer rows than are available in SQL?
  • Has anyone experienced different row counts between a SQL query and the Source operator in Visual Data Prep?

Any suggestions on how to troubleshoot this would be greatly appreciated.

Thanks!

1 ACCEPTED SOLUTION

Accepted Solutions

balajij8
Esteemed Contributor

Hi dax60,

What you are seeing comes down to the difference between processing limits and UI rendering limits in Visual Data Prep. When you set Rows scanned to Max you are instructing the engine to process all records from the source table for your interactive session. However, the preview pane itself has a separate cap on how much data it can render in your browser. The Truncated data warning is the key here as it indicates the UI is only displaying a subset of the data it actually fetched.

Preview rendering limit is not strictly based on a hardcoded row count and hence acts differently for different tables. It's dictated by the overall memory footprint of the data payload. Tables with wider columns, higher column counts, or heavier string sizes will hit that rendering ceiling much faster, causing one table to truncate at 2,692 rows while a narrower table might display entirely.

The 4,168 count in the direct SQL query is the source of truth. The truncation is purely a limitation of the interactive preview canvas and does not apply to the actual compute execution. Scheduled jobs and pipeline runs bypass these UI preview limits and will always process the full dataset.

To verify this in your workspace, you can write the output of this Source operator to a temporary target table. Trigger a full pipeline run and when you query that new target table via SQL, you will likely see all 4,168 rows successfully materialized.

View solution in original post

1 REPLY 1

balajij8
Esteemed Contributor

Hi dax60,

What you are seeing comes down to the difference between processing limits and UI rendering limits in Visual Data Prep. When you set Rows scanned to Max you are instructing the engine to process all records from the source table for your interactive session. However, the preview pane itself has a separate cap on how much data it can render in your browser. The Truncated data warning is the key here as it indicates the UI is only displaying a subset of the data it actually fetched.

Preview rendering limit is not strictly based on a hardcoded row count and hence acts differently for different tables. It's dictated by the overall memory footprint of the data payload. Tables with wider columns, higher column counts, or heavier string sizes will hit that rendering ceiling much faster, causing one table to truncate at 2,692 rows while a narrower table might display entirely.

The 4,168 count in the direct SQL query is the source of truth. The truncation is purely a limitation of the interactive preview canvas and does not apply to the actual compute execution. Scheduled jobs and pipeline runs bypass these UI preview limits and will always process the full dataset.

To verify this in your workspace, you can write the output of this Source operator to a temporary target table. Trigger a full pipeline run and when you query that new target table via SQL, you will likely see all 4,168 rows successfully materialized.