Turn on suggestions
Auto-suggest helps you quickly narrow down your search results by suggesting possible matches as you type.
Showing results for
Data Engineering
Join discussions on data engineering best practices, architectures, and optimization strategies within the Databricks Community. Exchange insights and solutions with fellow data engineers.
Turn on suggestions
Auto-suggest helps you quickly narrow down your search results by suggesting possible matches as you type.
Showing results for
- Databricks Community
- Data Engineering
- Is it possible to show multiple cmd output in a da...
Options
- Subscribe to RSS Feed
- Mark Topic as New
- Mark Topic as Read
- Float this Topic for Current User
- Bookmark
- Subscribe
- Mute
- Printer Friendly Page
Options
- Mark as New
- Bookmark
- Subscribe
- Mute
- Subscribe to RSS Feed
- Permalink
- Report Inappropriate Content
11-23-2021 09:30 AM
I have a loop that outputs a dataframe for values in a list; basically a loop.
I can create a dashboard if there is only one df but in the loop, I'm only able to see the charts in the notebook if I switch the view to charts not in the dashboard. In the dashboard, it only shows the first chart.
Is it possible to show all the charts created in a loop in the dashboard or is it limited to 1?
Labels:
- Labels:
-
Dashboards
-
Loop
-
Visualization
1 ACCEPTED SOLUTION
Accepted Solutions
Options
- Mark as New
- Bookmark
- Subscribe
- Mute
- Subscribe to RSS Feed
- Permalink
- Report Inappropriate Content
11-23-2021 10:04 AM
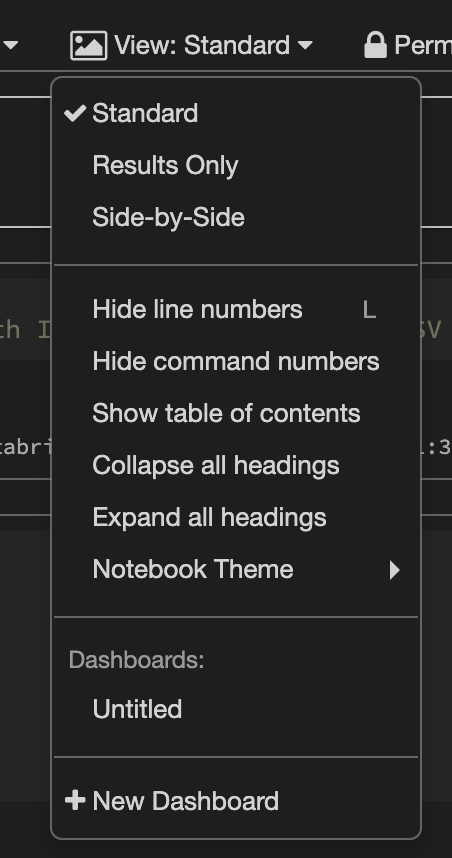
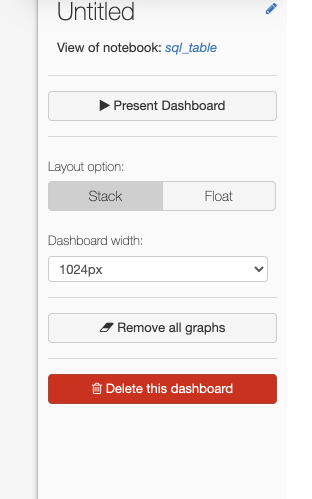
- Create a new Dashboard
- You will find multiple chart or table displayed in the Dashboard. Click on remove all graphs to clear the Dashboard.
- To import all graphs from the notebook you can click on "Import all Graphs" which will be displayed on the Dashboard.
- If you want only a few graphs to be displayed then go to the notebook view.
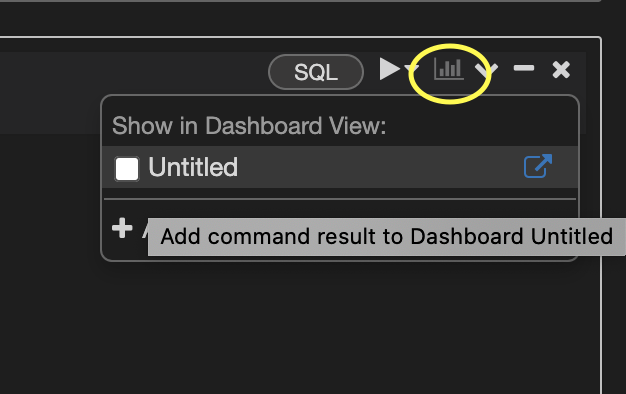
- If your command has a table or chart output, you can see the encircled symbol on the right corner of the cell.
- Click on that image that will give you the option to select it to show in your desired dashboard.
- You can go to the respective cells that you want to display in the Dashboard and add it to view in the Dashboard.
4 REPLIES 4
Options
- Mark as New
- Bookmark
- Subscribe
- Mute
- Subscribe to RSS Feed
- Permalink
- Report Inappropriate Content
11-23-2021 09:50 AM
Yes, you can show all charts or only a few charts in the dashboards as per your requirement.
Options
- Mark as New
- Bookmark
- Subscribe
- Mute
- Subscribe to RSS Feed
- Permalink
- Report Inappropriate Content
11-23-2021 10:04 AM
- Create a new Dashboard
- You will find multiple chart or table displayed in the Dashboard. Click on remove all graphs to clear the Dashboard.
- To import all graphs from the notebook you can click on "Import all Graphs" which will be displayed on the Dashboard.
- If you want only a few graphs to be displayed then go to the notebook view.
- If your command has a table or chart output, you can see the encircled symbol on the right corner of the cell.
- Click on that image that will give you the option to select it to show in your desired dashboard.
- You can go to the respective cells that you want to display in the Dashboard and add it to view in the Dashboard.
Options
- Mark as New
- Bookmark
- Subscribe
- Mute
- Subscribe to RSS Feed
- Permalink
- Report Inappropriate Content
11-23-2021 11:19 AM
could you please show me how?
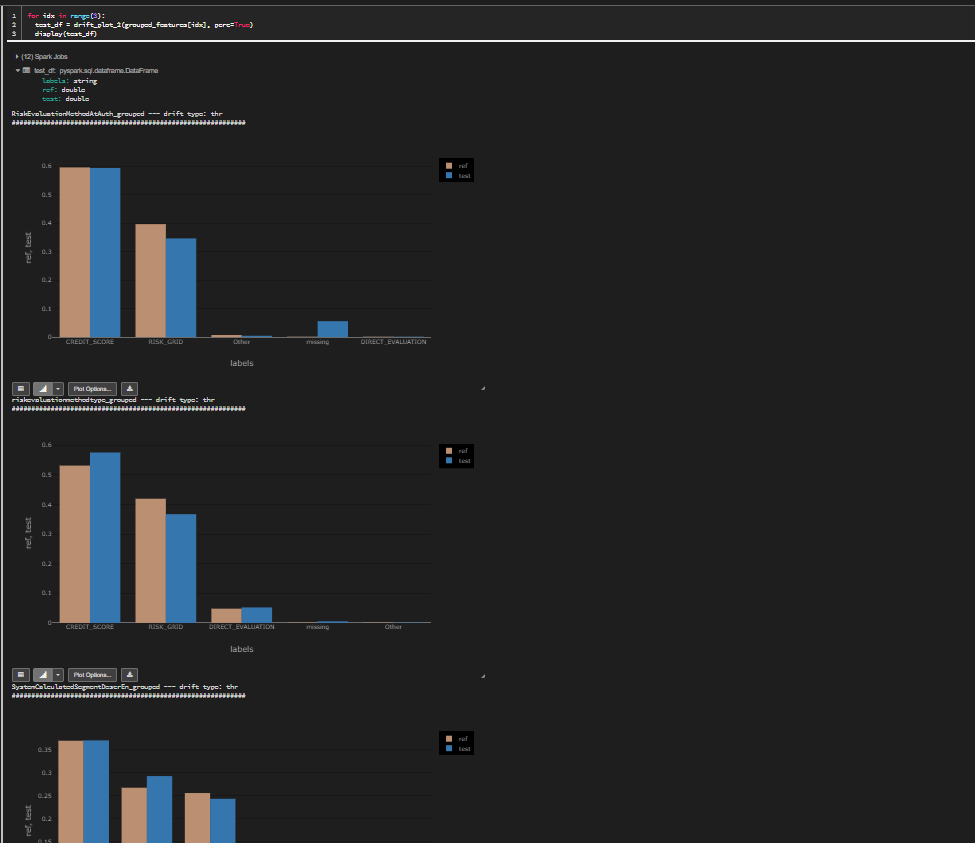
I can only see the first plot in the dashboard. Note that I am NOT talking about showing the output of multiple cmds but multiple outputs of ONE cmd in a loop.
In the following code snippet, for each idx, I have one test_df for which I can see the result in the notebook but not when I create New Dashboard as you mentioned. In the New dashboard only the first plot is shown.
for idx in range(3):
  test_df = drift_plot_2(grouped_features[idx], perc=True)
  display(test_df)
Dashboard view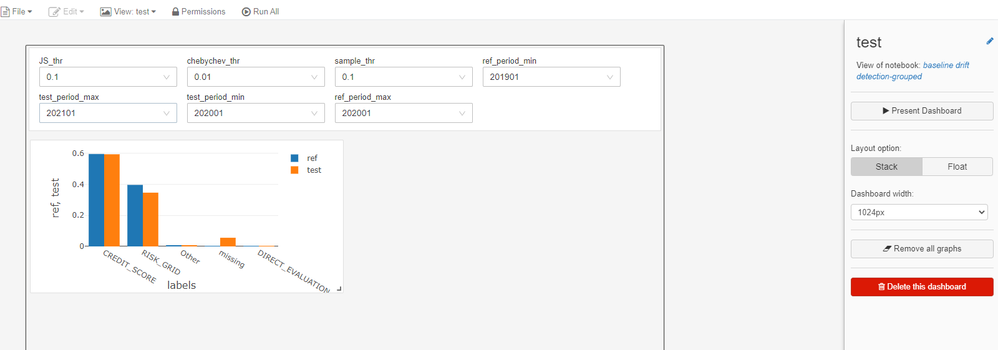
Notebook view
Options
- Mark as New
- Bookmark
- Subscribe
- Mute
- Subscribe to RSS Feed
- Permalink
- Report Inappropriate Content
11-24-2021 04:23 AM
If you want to be able to easily run and kill multiple process with
ctrl-c
, this is my favorite method: spawn multiple background processes in a
(…)
subshell, and trap
SIGINT
to execute
kill 0
, which will kill everything spawned in the subshell group:
Announcements
Related Content
- Is the serverless budget/usage feature officially broken for certain serverless job "types"? in Data Governance
- Lakeflow Connect: Data Ingestion from SQL Server to Databricks in Data Engineering
- I built a free 11-tab Cost Observability Dashboard as a Databricks App — open source in Administration & Architecture
- Does Lakeflow Connect Have Any Change Tracking Diagnostics? in Data Engineering
- Steps to become a Databricks Consultant. in Warehousing & Analytics
