Hi @PJ11 ,
As per documentation:
UpSetPlot internally works with data based on Pandas data structures: a Series when all you care about is counts, or a DataFrame when you’re interested in visualising additional properties of the data, such as with the UpSet.add_catplot method.
UpSetPlot expects the Series or DataFrame to have a MultiIndex as input, with this index being an indicator matrix. Specifically, each category is a level in the pandas.MultiIndex with boolean values.
Make sure to convert your your spark dataframes to pandas dataframes.
df_pandas = df.toPandas()
Please check below end-to-end example, that includes:
1. Initial data preparation (to simulate some data you can read from a table)
# Import necessary libraries
import pandas as pd
from upsetplot import UpSet
import matplotlib.pyplot as plt

from pyspark.sql.functions import explode, array, lit, col
from pyspark.sql.types import BooleanType

# Simulate data for the Spark DataFrame
data = [
    (1, False, False, False, False),
    (2, False, True, False, False),
    (3, False, True, True, False),
    (4, False, False, True, False),
    (5, True, False, False, False),
    (6, True, True, False, False),
    (7, False, False, False, True),
    (8, True, False, True, False),
    (9, True, True, True, False),
    (10, False, True, False, True),
    (11, False, False, True, True),
    (12, False, True, True, True),
    (13, True, False, False, True),
    (14, True, True, False, True),
    (15, True, True, True, True),
    (16, True, False, True, True),
]

counts = [169, 159, 110, 108, 84, 69, 49, 46, 43, 35, 32, 31, 22, 20, 14, 9]

# Create a Spark DataFrame
columns = ['member_id', 'Feature_A', 'Feature_B', 'Feature_C', 'Feature_D']
df_spark = spark.createDataFrame([dict(zip(columns, row)) for row in data])

# Create a list of counts as an array column
df_with_counts = df_spark.withColumn('count', lit(0))  # Placeholder column

for i, count in enumerate(counts):
    df_with_counts = df_with_counts.union(
        df_spark.filter(col('member_id') == data[i][0])
        .withColumn('count', array([lit(1)] * count))
        .withColumn('count', explode(col('count')))
    )

# Remove the placeholder rows
df_with_counts = df_with_counts.filter(col('count') != 0)

# Drop 'member_id' column
df_transformed = df_with_counts.drop('member_id', 'count')

for col_name in ['Feature_A', 'Feature_B', 'Feature_C', 'Feature_D']:
    df_transformed = df_transformed.withColumn(col_name, col(col_name).cast(BooleanType()))

display(df_transformed)
2. Conversions to pandas objects and then creation of the upset plot
# Convert the Spark DataFrame to a pandas DataFrame
df_pandas = df_transformed.toPandas()

# Group by all feature columns and count the occurrences
df_counts = df_pandas.groupby(['Feature_A', 'Feature_B', 'Feature_C', 'Feature_D']).size().reset_index(name='count')

# Create a MultiIndex from the feature columns
index = pd.MultiIndex.from_frame(df_counts[['Feature_A', 'Feature_B', 'Feature_C', 'Feature_D']])

# Create a Series with counts, using the MultiIndex
data_counts = pd.Series(df_counts['count'].values, index=index)

# Display the Series (optional)
print("Series with MultiIndex:")
display(data_counts)

upset = UpSet(
    data_counts,
    subset_size='auto',          # Use the counts provided in the Series
    show_counts='%d',            # Display counts on top of bars
    sort_by='cardinality',       # Sort subsets by counts
    sort_categories_by='-input',
    facecolor='blue',            # Set bar color to blue
)

# Generate the plot
fig = plt.figure(figsize=(12, 8))
upset.plot(fig=fig)

# Display the plot
plt.show()
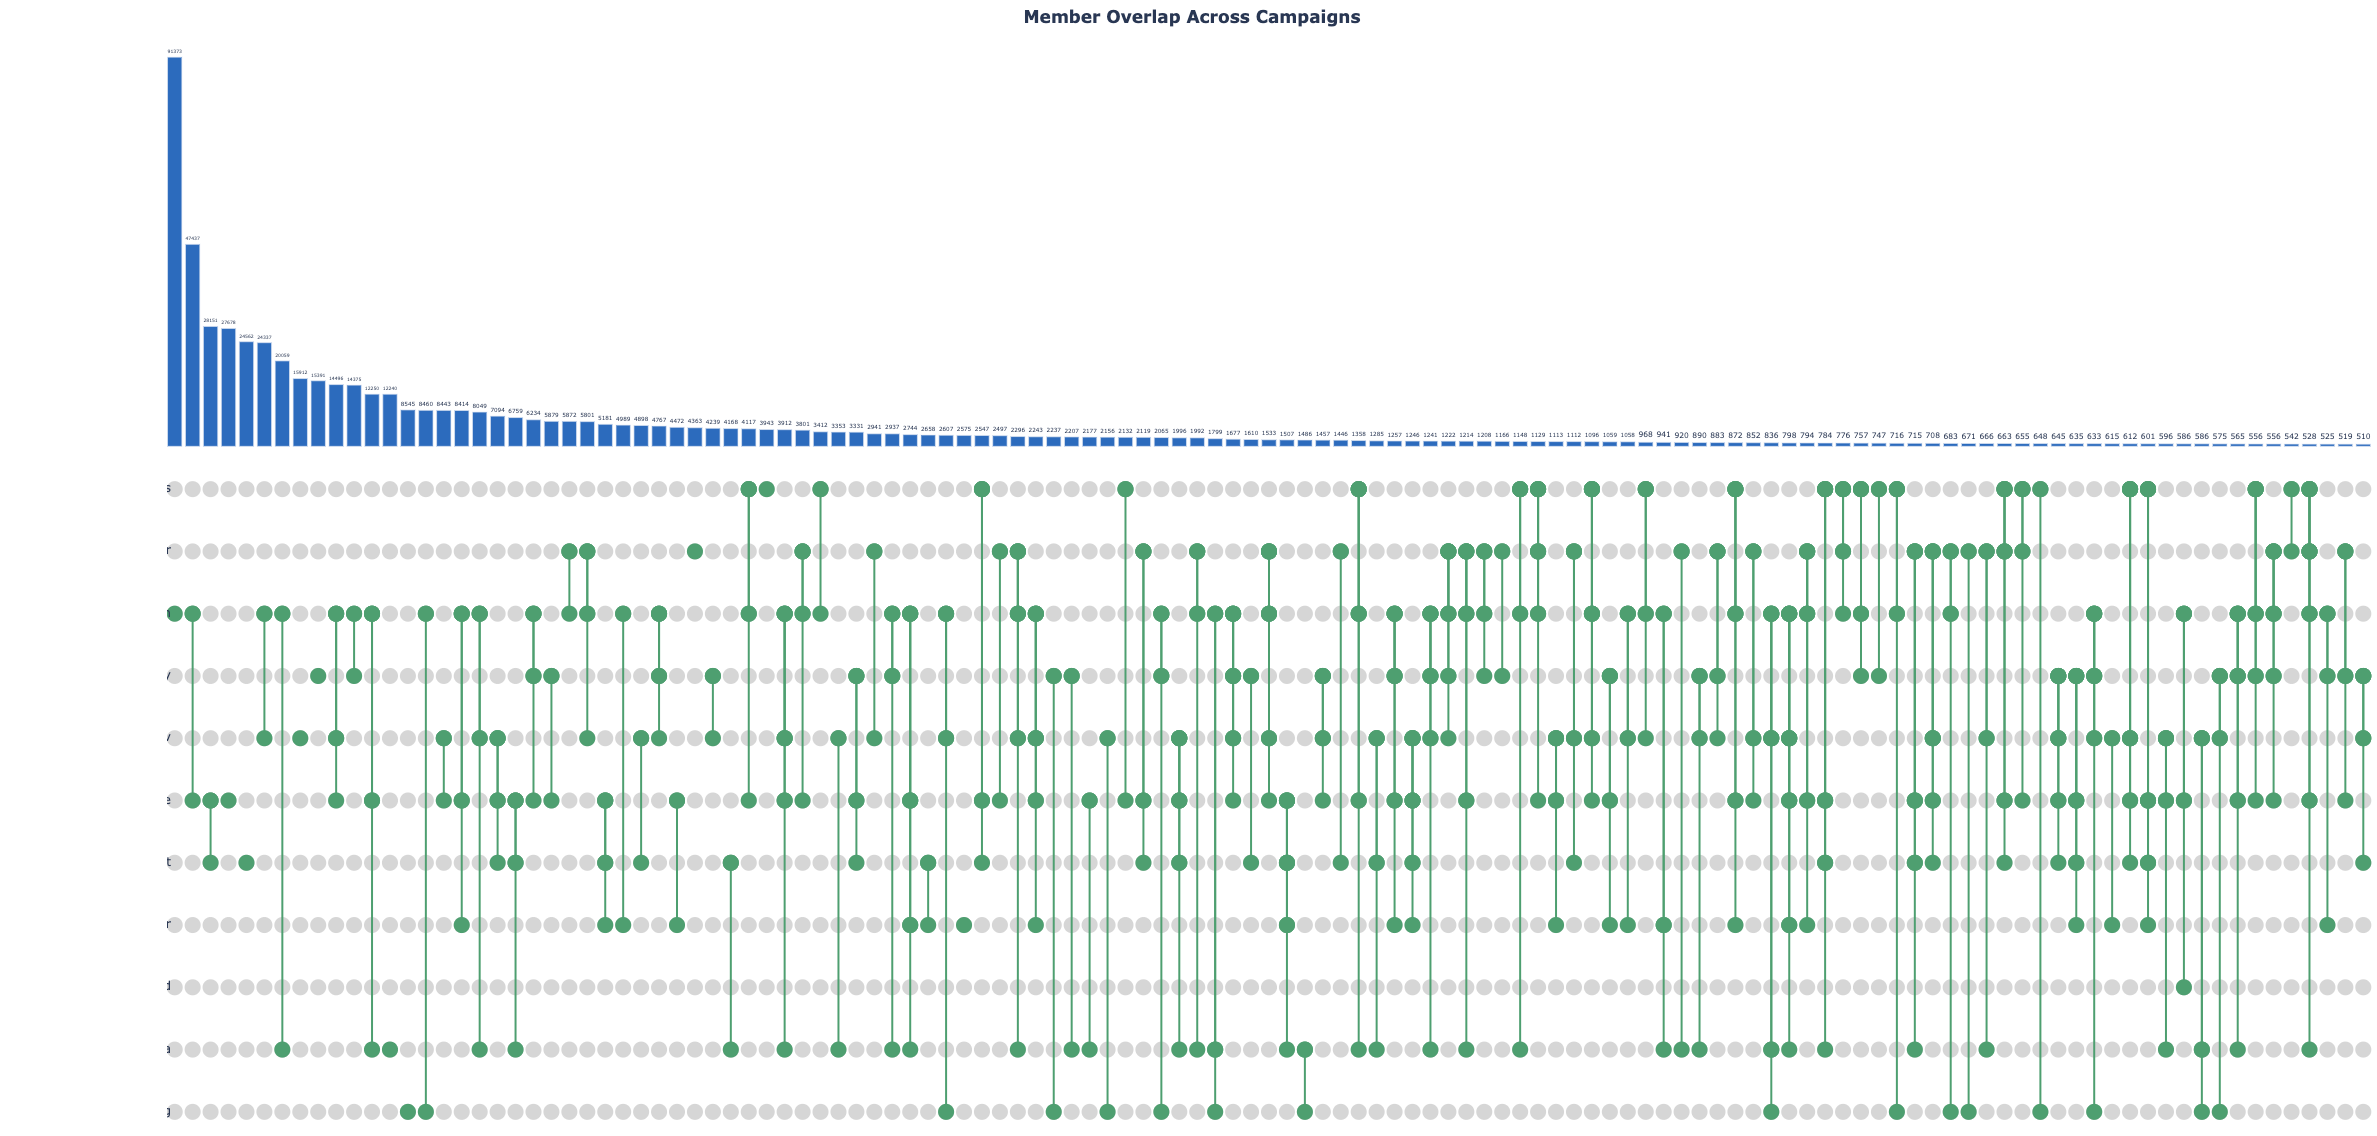
Final output:


