Turn on suggestions
Auto-suggest helps you quickly narrow down your search results by suggesting possible matches as you type.
Showing results for
Data Engineering
Join discussions on data engineering best practices, architectures, and optimization strategies within the Databricks Community. Exchange insights and solutions with fellow data engineers.
Turn on suggestions
Auto-suggest helps you quickly narrow down your search results by suggesting possible matches as you type.
Showing results for
- Databricks Community
- Data Engineering
- Visualizations from notebook keeps on disappearing
Options
- Subscribe to RSS Feed
- Mark Topic as New
- Mark Topic as Read
- Float this Topic for Current User
- Bookmark
- Subscribe
- Mute
- Printer Friendly Page
Visualizations from notebook keeps on disappearing
Options
- Mark as New
- Bookmark
- Subscribe
- Mute
- Subscribe to RSS Feed
- Permalink
- Report Inappropriate Content
09-29-2022 06:33 AM
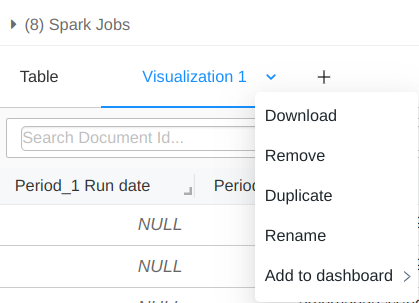
I have created a notebook which filters on the main table and generates bar graph. The graphs keeps on disappearing and sometimes they dont generate at all.
PFA. 'Visualization 1' has issues. Each time I run notebook manually, I have to build the graph and pin to the dashboard and rearrange them which seems arduous since I have atleast 15 different graphs

Labels:
- Labels:
-
Notebook
-
Visualizations


11 REPLIES 11
Options
- Mark as New
- Bookmark
- Subscribe
- Mute
- Subscribe to RSS Feed
- Permalink
- Report Inappropriate Content
09-30-2022 12:11 PM
Hello @Sneha Mulrajani,
My name is Andrew and I'm an engineer on the Notebooks team. Could you link the Notebook where this is happening? I'll create an ES ticket and debug the issue
Options
- Mark as New
- Bookmark
- Subscribe
- Mute
- Subscribe to RSS Feed
- Permalink
- Report Inappropriate Content
10-04-2022 02:25 AM
Attaching the HTML format of the notebook. Here you can see the tab 'Vizualization 1' but it keeps on disappearing
Options
- Mark as New
- Bookmark
- Subscribe
- Mute
- Subscribe to RSS Feed
- Permalink
- Report Inappropriate Content
10-04-2022 11:24 AM
Hello! A full link to the Notebook would be most helpful to get to a quick resolution. I attached a video looking at the HTML Notebook you sent but I'm not able to reproduce
Options
- Mark as New
- Bookmark
- Subscribe
- Mute
- Subscribe to RSS Feed
- Permalink
- Report Inappropriate Content
10-05-2022 02:01 AM
Hello! A full link to the Notebook would be most helpful to get to a quick resolution. I attached a video looking at the HTML Notebook you sent but I'm not able to reproduce...
Options
- Mark as New
- Bookmark
- Subscribe
- Mute
- Subscribe to RSS Feed
- Permalink
- Report Inappropriate Content
10-06-2022 01:21 AM
@Andrew Freix @Rubel Ahamed @Sneha Mulrajani eha15
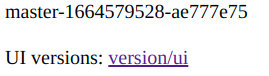
Can you please share the workspace URL version output? so that I can check your workspace and let you know whether new Visualization is enabled or not.
Please run the below URL in your web browser :
Options
- Mark as New
- Bookmark
- Subscribe
- Mute
- Subscribe to RSS Feed
- Permalink
- Report Inappropriate Content
10-06-2022 01:28 AM

Options
- Mark as New
- Bookmark
- Subscribe
- Mute
- Subscribe to RSS Feed
- Permalink
- Report Inappropriate Content
10-06-2022 01:29 AM
Does this help @Abishek Subramanian ?
Options
- Mark as New
- Bookmark
- Subscribe
- Mute
- Subscribe to RSS Feed
- Permalink
- Report Inappropriate Content
10-06-2022 01:35 AM
@Sneha Mulrajani
Can you share the branch output
For example :
branch-3.81-xxxxxxxxxxxxxxx
Options
- Mark as New
- Bookmark
- Subscribe
- Mute
- Subscribe to RSS Feed
- Permalink
- Report Inappropriate Content
10-06-2022 06:42 AM

Options
- Mark as New
- Bookmark
- Subscribe
- Mute
- Subscribe to RSS Feed
- Permalink
- Report Inappropriate Content
10-07-2022 06:27 AM
May I know the cloud provider?
Options
- Mark as New
- Bookmark
- Subscribe
- Mute
- Subscribe to RSS Feed
- Permalink
- Report Inappropriate Content
10-07-2022 06:39 AM
Its AWS
Some more information to add: When I schedule the notebook for nightly runs. I can see the graphs in the job output whereas I only see the tables out of which visualisation was generated when running the notebook manually. It is a bit strange
Announcements


Related Content
- Databricks app and R shiny in Machine Learning
- Image disappears after notebook export to HTML in Data Engineering
- Add Visualization in Notebook to Dashboard, how to set default add to Dashboard Bottom in Warehousing & Analytics
- Version control for databricks notebook visualizations? in Data Engineering
- Data Science & Engineering Dashboard Refresh Issue Using Databricks in Data Engineering