Turn on suggestions
Auto-suggest helps you quickly narrow down your search results by suggesting possible matches as you type.
Showing results for
Data Governance
Join discussions on data governance practices, compliance, and security within the Databricks Community. Exchange strategies and insights to ensure data integrity and regulatory compliance.
Turn on suggestions
Auto-suggest helps you quickly narrow down your search results by suggesting possible matches as you type.
Showing results for
- Databricks Community
- Data Governance
- Re: Databricks Audit Logs, Where can I find table ...
Options
- Subscribe to RSS Feed
- Mark Topic as New
- Mark Topic as Read
- Float this Topic for Current User
- Bookmark
- Subscribe
- Mute
- Printer Friendly Page
Options
- Mark as New
- Bookmark
- Subscribe
- Mute
- Subscribe to RSS Feed
- Permalink
- Report Inappropriate Content
02-24-2023 11:09 PM
Hi,
I want to access the Databricks Audit Logs to check the table usage information.
I created a Databricks workspace on the premium pricing tier and enabled it for the Unity Catalogue.
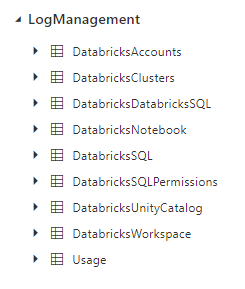
I configured Audit logs to be sent to Azure Diagnostic log delivery. What I got in the "Log Analytics Workspace".

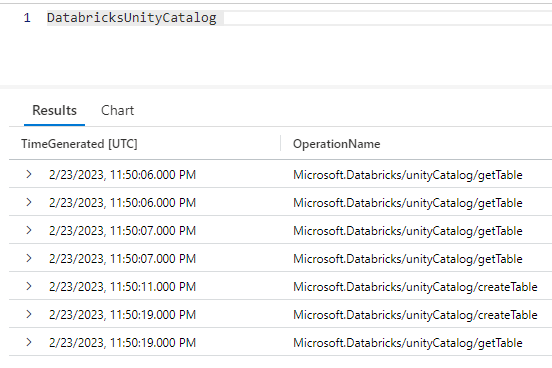
I can see table usage information in "DatabricksUnityCatalog “ for tables managed by Unity Catalogue.
After a few days of testing, I noticed that I don't get any logs when I query tables either in a notebook running on a cluster or in the SQL persona.
There is an ActionName "getTable" where I can see table names. But, its timestamp is corresponding to the time when I created a table (not when I queried tables).

I queried tables on Feb 22, 23, and 24th at specific times, but there are no logs related to those actions. Also, I cannot find queries I run in other log tables like "DatabircksSQL".
Please let me know where I can find information about table usage or queries (if there are any).
Also, note that I get logs after at least 1 day, even though it is supposed to be updated every 15 min according to the documentation.
Labels:
1 ACCEPTED SOLUTION
Accepted Solutions
Options
- Mark as New
- Bookmark
- Subscribe
- Mute
- Subscribe to RSS Feed
- Permalink
- Report Inappropriate Content
04-09-2023 06:56 PM
@Mohammad Saber :
Table Access Control (TAC) is a security feature in Databricks that allows you to control access to tables and views in Databricks. With TAC, you can restrict access to specific tables or views to specific users, groups, or roles.
To set up and configure TAC in Databricks, you can follow these steps:
- Create a new workspace in Databricks or use an existing one.
- In the workspace, go to the "Admin Console" and click on the "Permissions" tab.
- Click on the "Table Access Control" tab and enable it.
- Under "TAC Rules," click on the "Add Rule" button.
- In the "Add Rule" dialog box, select the database and table or view that you want to restrict access to.
- Under "Action," select the type of access you want to restrict, such as "Read" or "Write."
- Under "Principal," select the user, group, or role that you want to restrict access for.
- Click on the "Add" button to save the rule.
- Repeat steps 4-8 for each table or view that you want to restrict access to.
- Once you have added all the TAC rules you need, click on the "Save" button to apply the changes.
- Test the TAC rules by logging in as a user or role that you have restricted access for and trying to access the restricted tables or views.
That's it! You have now set up and configured TAC in Databricks.
8 REPLIES 8
Anonymous
Not applicable
Options
- Mark as New
- Bookmark
- Subscribe
- Mute
- Subscribe to RSS Feed
- Permalink
- Report Inappropriate Content
04-09-2023 07:32 AM
@Mohammad Saber :
It seems that you have correctly configured the Audit logs to be sent to Azure Diagnostic log delivery and you are able to see the table usage information in "DatabricksUnityCatalog" for tables managed by Unity Catalogue. However, you are not able to see any logs related to querying tables or SQL queries.
Regarding the delay in receiving logs, please note that the 15-minute log delivery frequency refers to the frequency at which logs are sent to the log delivery destination (Azure Diagnostic log delivery in your case). However, there can be additional latency in the log processing pipeline, which can cause a delay of up to 24 hours in some cases.
Regarding the missing logs related to table queries or SQL queries, it is possible that these logs are not being captured by the Audit logs. The "getTable" action you see in the logs is related to the creation of the table and not querying it.
To capture the SQL queries, you can enable query logging in Databricks. Once query logging is enabled, you should be able to see SQL queries in the "DatabricksSQL" log table.
To capture the table queries, you can use the Databricks Table Access Control (TAC) feature. This feature allows you to audit and control access to tables in Databricks. You can enable TAC and configure it to audit table access.
Once TAC is enabled, you should be able to see the table access logs in the "DatabricksTableAccessControl" log table. These logs will contain information about the users who accessed the table and the actions they performed (e.g., read, write).
I hope this helps! Let me know if you have any further questions.
Options
- Mark as New
- Bookmark
- Subscribe
- Mute
- Subscribe to RSS Feed
- Permalink
- Report Inappropriate Content
07-11-2023 06:06 AM
Options
- Mark as New
- Bookmark
- Subscribe
- Mute
- Subscribe to RSS Feed
- Permalink
- Report Inappropriate Content
04-09-2023 04:09 PM
Thanks @Suteja Kanuri
Could you guide me on how to setup and configure Table Access Control (TAC)?
Options
- Mark as New
- Bookmark
- Subscribe
- Mute
- Subscribe to RSS Feed
- Permalink
- Report Inappropriate Content
04-09-2023 06:56 PM
@Mohammad Saber :
Table Access Control (TAC) is a security feature in Databricks that allows you to control access to tables and views in Databricks. With TAC, you can restrict access to specific tables or views to specific users, groups, or roles.
To set up and configure TAC in Databricks, you can follow these steps:
- Create a new workspace in Databricks or use an existing one.
- In the workspace, go to the "Admin Console" and click on the "Permissions" tab.
- Click on the "Table Access Control" tab and enable it.
- Under "TAC Rules," click on the "Add Rule" button.
- In the "Add Rule" dialog box, select the database and table or view that you want to restrict access to.
- Under "Action," select the type of access you want to restrict, such as "Read" or "Write."
- Under "Principal," select the user, group, or role that you want to restrict access for.
- Click on the "Add" button to save the rule.
- Repeat steps 4-8 for each table or view that you want to restrict access to.
- Once you have added all the TAC rules you need, click on the "Save" button to apply the changes.
- Test the TAC rules by logging in as a user or role that you have restricted access for and trying to access the restricted tables or views.
That's it! You have now set up and configured TAC in Databricks.
Options
- Mark as New
- Bookmark
- Subscribe
- Mute
- Subscribe to RSS Feed
- Permalink
- Report Inappropriate Content
04-09-2023 07:57 PM
Thanks @Suteja Kanuri
Can I setup TAC if workspace is enabled for unity catalog?
Options
- Mark as New
- Bookmark
- Subscribe
- Mute
- Subscribe to RSS Feed
- Permalink
- Report Inappropriate Content
04-09-2023 08:06 PM
@Mohammad Saber :
Yes, you can set up TAC (Databricks Table Access Control) even if workspace is enabled for Unity Catalog in Databricks.
Unity Catalog is an alternative to the Databricks Delta Lake table format and is fully compatible with Delta Lake. TAC allows you to manage access control to tables and views in the Databricks environment.
Once TAC is enabled, you can use it to control access to tables and views in the Unity Catalog as well as in the Delta Lake format.
Options
- Mark as New
- Bookmark
- Subscribe
- Mute
- Subscribe to RSS Feed
- Permalink
- Report Inappropriate Content
01-17-2024 02:55 AM
Hey, thank you for all the inputs you gave until now!
There is just one more thing that I want to clarify about the TAC in combination with UC. If I enable TAC for an UC table is it going to generate table access logs if the table is queried from a different the workspace as well?
Just giving more context, in my case I'm generating an UC table in my own workspace and there are another teams that are going to query that table using their own workspace, what I want to figure out is which teams and with which frequency are those other team querying the table that I produced.
Options
- Mark as New
- Bookmark
- Subscribe
- Mute
- Subscribe to RSS Feed
- Permalink
- Report Inappropriate Content
01-17-2024 12:36 PM
Announcements
Related Content
- Databricks Genie Code One Month In — What It Means for Us as Data Engineers in Generative AI
- Knowledge cutoff for Genie in Generative AI
- Unable to connect to any cluster from a notebook in Administration & Architecture
- Metric views joins in Data Engineering
- databricks-connect serverless GRPC issue in Data Engineering


